> ## Documentation Index
> Fetch the complete documentation index at: https://docs.userpilot.com/llms.txt
> Use this file to discover all available pages before exploring further.
# Mobile content performance analytics
> Userpilot's mobile content analytics gives you a detailed, real-time view of how recipients interact with your mobile content.
## Overview
Userpilot's mobile content analytics gives you a detailed, real-time view of how recipients interact with your mobile content. With built-in filters, visual trend graphs, and granular user-level reporting, you can monitor deliverability, engagement, and unsubscribe behavior, helping you refine your messaging and improve outcomes over time.
## Key metrics and completion overview
### Key metrics for the carousel and slideout
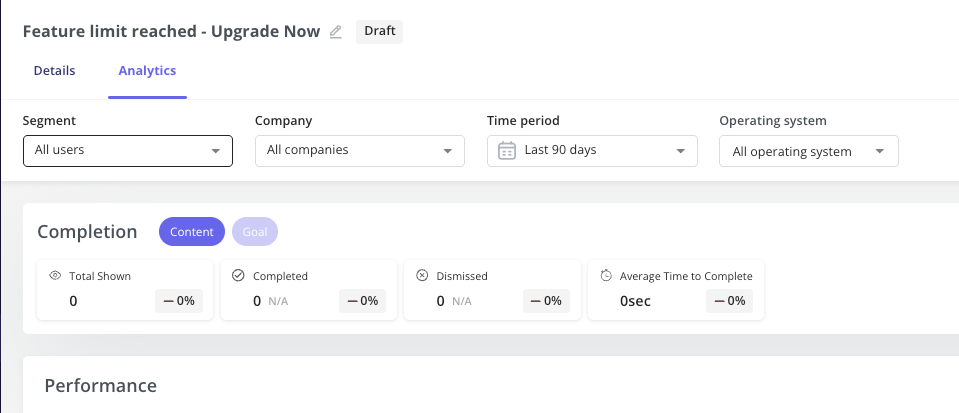
* **Total Shown:** the number of unique users who received and saw the carousel/slideout on their device.
* **Completed:** the number of users who completed all the carousel steps, or clicked on the CTA in the slideout.
* **Dismissed:** the number of users who dismissed the carousel/slideout.
* **Average Time to Complete (carousel only):** the average time it took users to complete all the carousel steps.
 ### Key metrics for the push notification
* **Total Sent:** the number of unique users who were successfully sent the push notification.
* **Opened:** the number of users who tapped the push notification to open your app or navigate to the target screen.
* **Average Open Time:** the average time it took users to open the notification after receiving it, helping you understand how quickly users engage with your message.
### Key metrics for the push notification
* **Total Sent:** the number of unique users who were successfully sent the push notification.
* **Opened:** the number of users who tapped the push notification to open your app or navigate to the target screen.
* **Average Open Time:** the average time it took users to open the notification after receiving it, helping you understand how quickly users engage with your message.
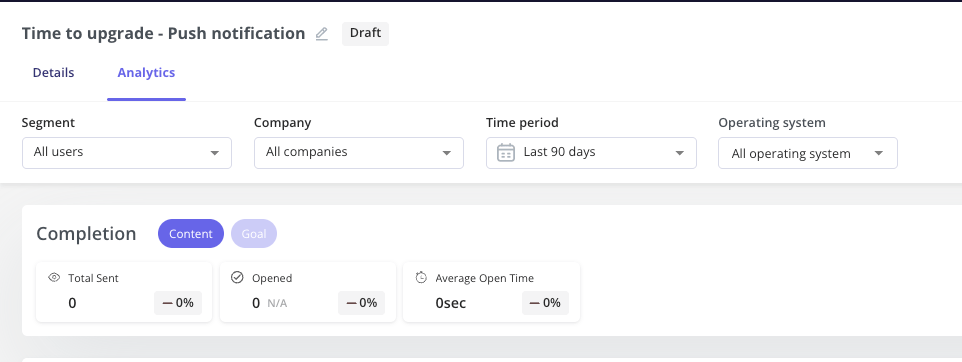 Each metric includes a visual indicator (green or red arrow) showing the percentage change compared to the previous period (e.g., +3% from the last 7 days).
## Filters and segmentation
You can filter the data by:
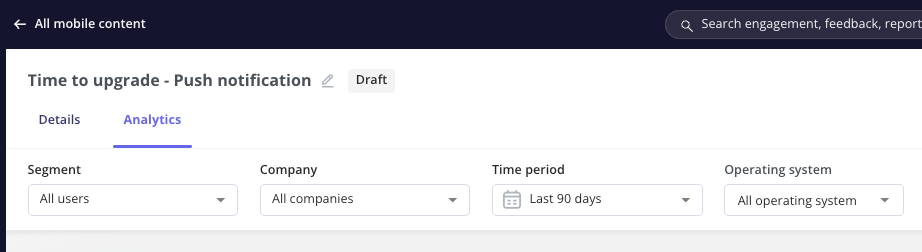
* **Segment** - based on the defined user segments you created.
* **Company** - filter by specific company segments you created.
* **Time Period** - choose from preset ranges (e.g., Last 7 days) to view recent or historical trends.
* **Operating System:** filter your mobile content data by iOS or Android.
This helps you **analyze performance separately** for each platform, so you can spot differences in user behavior, optimize your message for specific devices, and tailor future campaigns based on what works best for each operating system.
Each metric includes a visual indicator (green or red arrow) showing the percentage change compared to the previous period (e.g., +3% from the last 7 days).
## Filters and segmentation
You can filter the data by:
* **Segment** - based on the defined user segments you created.
* **Company** - filter by specific company segments you created.
* **Time Period** - choose from preset ranges (e.g., Last 7 days) to view recent or historical trends.
* **Operating System:** filter your mobile content data by iOS or Android.
This helps you **analyze performance separately** for each platform, so you can spot differences in user behavior, optimize your message for specific devices, and tailor future campaigns based on what works best for each operating system.
 ## Performance trends
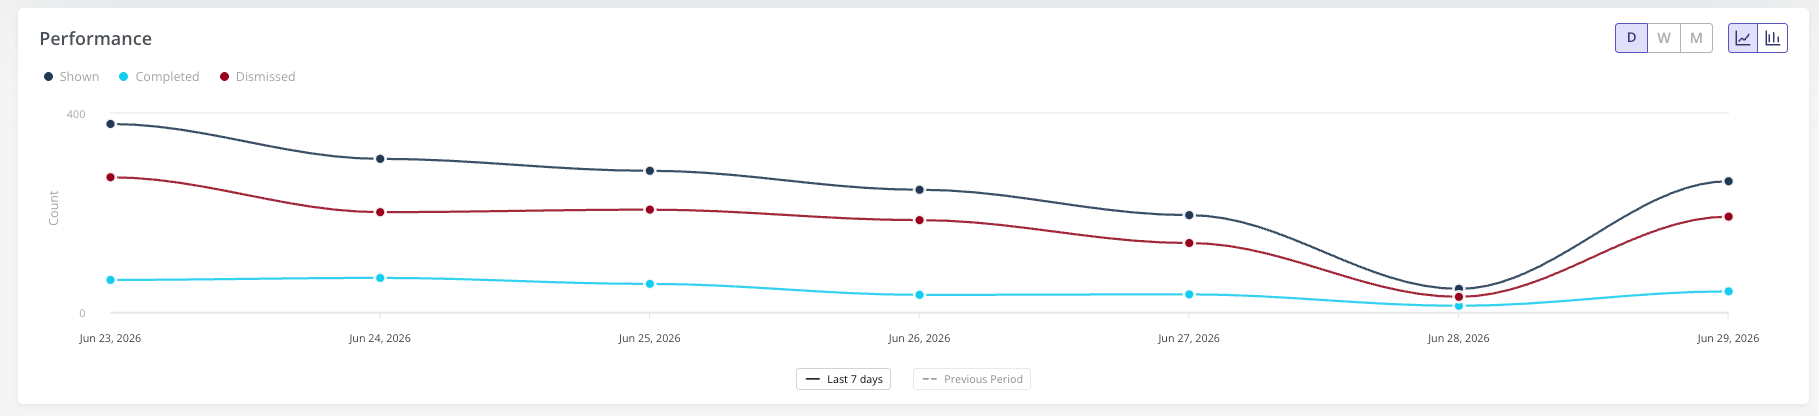
The Performance graph helps you visualize user interactions over time. It displays daily counts for:
**Carousel and slideout**
* Total shown
* Completed
* Dismissed
**Push** **notification**
* Total sent
* Opened
Each line represents a different metric, and hovering over a point reveals the exact data value for that date. You can toggle between daily, weekly, and monthly views.
## Performance trends
The Performance graph helps you visualize user interactions over time. It displays daily counts for:
**Carousel and slideout**
* Total shown
* Completed
* Dismissed
**Push** **notification**
* Total sent
* Opened
Each line represents a different metric, and hovering over a point reveals the exact data value for that date. You can toggle between daily, weekly, and monthly views.
 ## User-level activity table
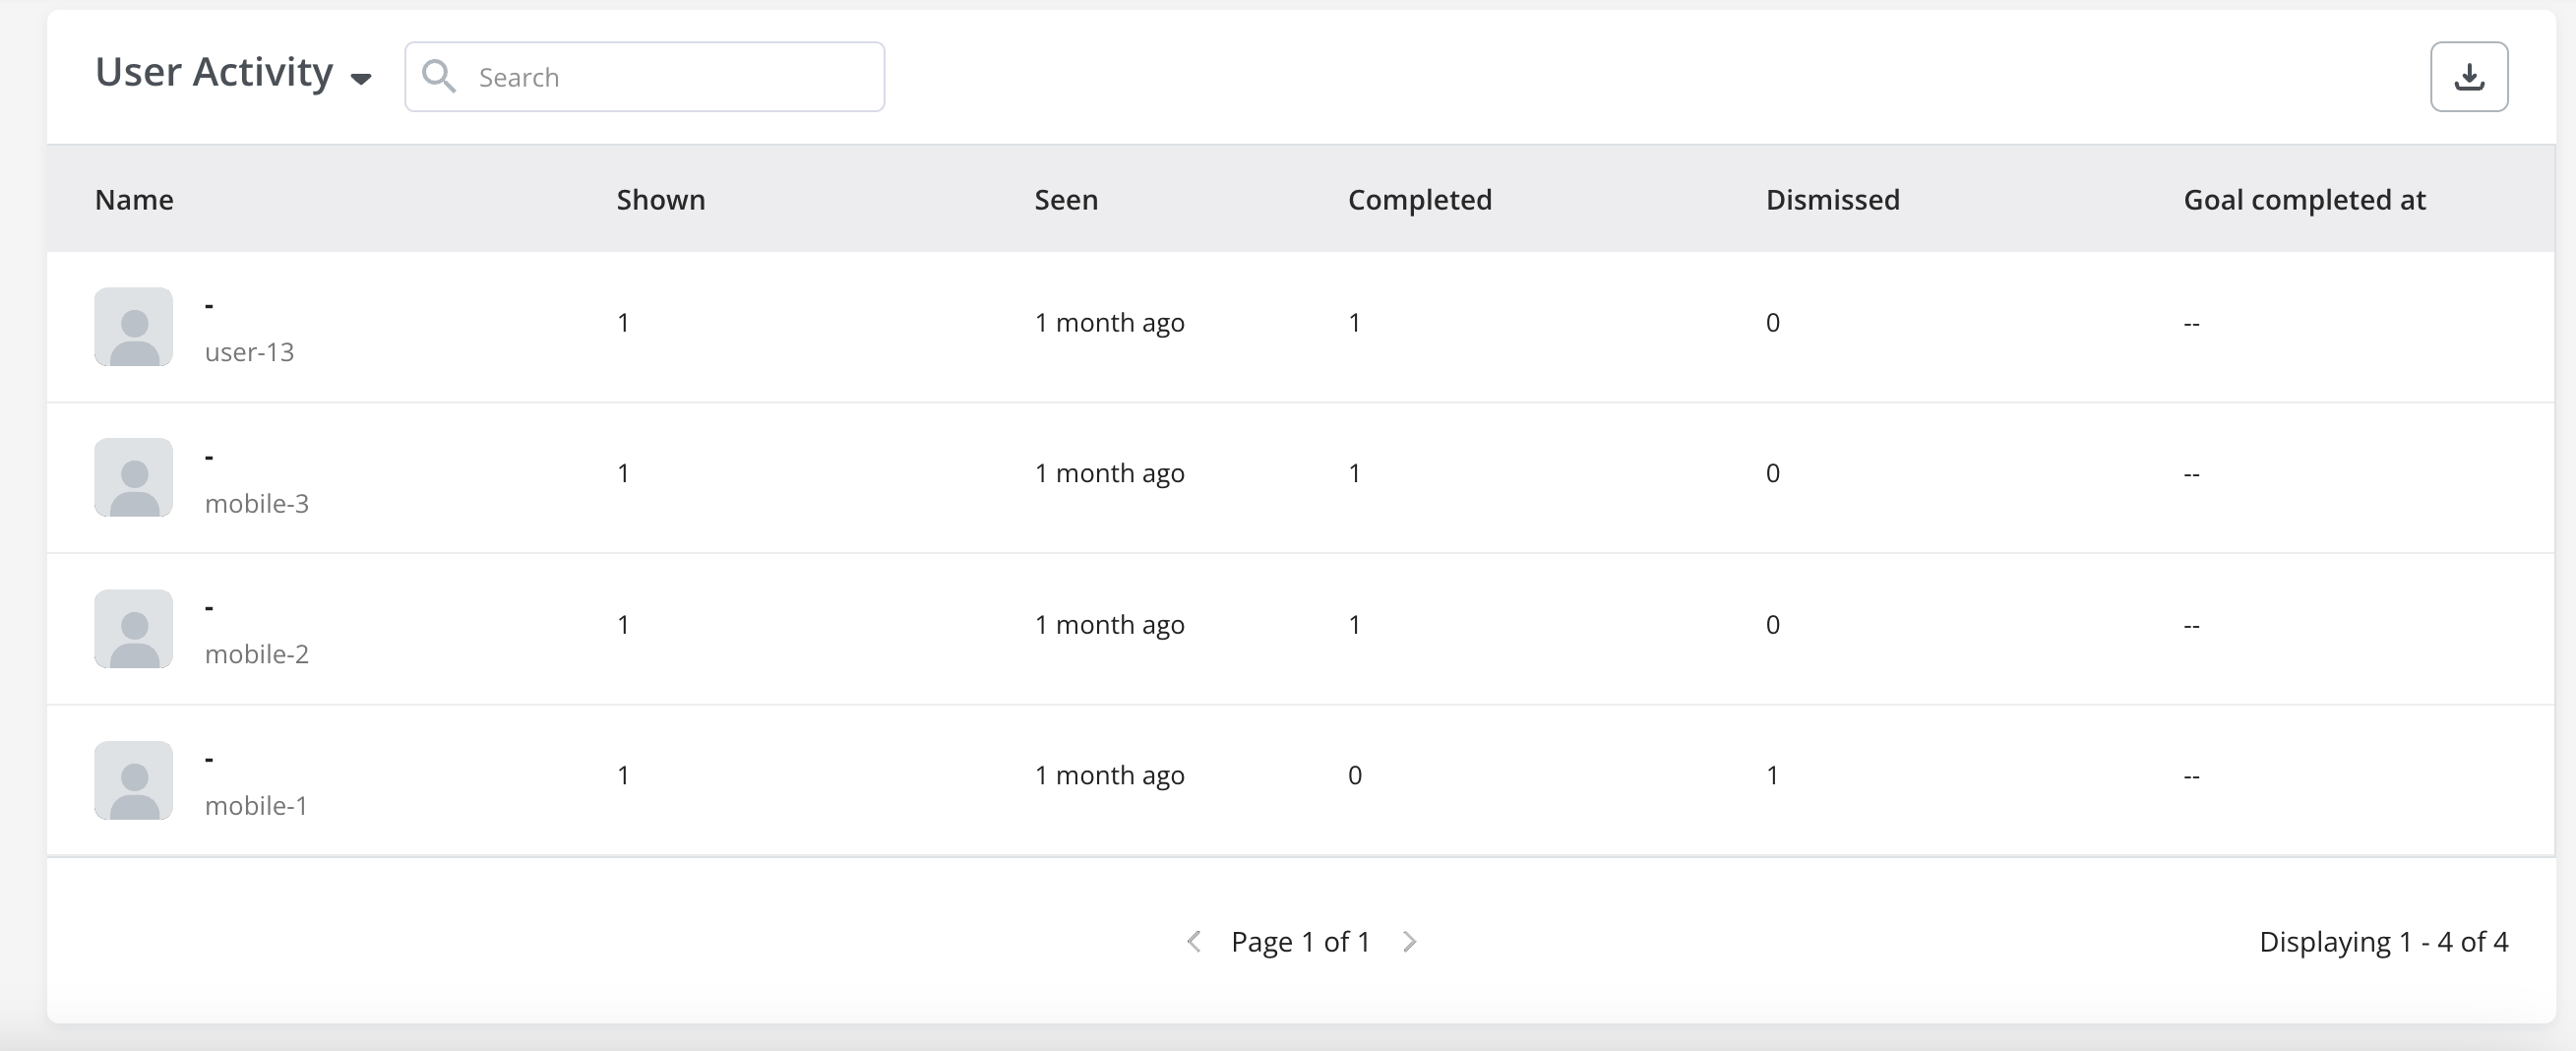
Below the graph, the User Activity section provides detailed breakdowns at the individual user level, including:
* **Name and ID:** displays the user's name or identifier. Useful for recognizing individual users in the activity list.
* **Shown:** the number of times the carousel/slideout was delivered and displayed to the user.
* **Seen:** the timestamp or time period indicating when the user last received or saw the carousel/slideout.
* **Completed:** indicates whether the user completed all carousel steps or clicked the CTA in the slideout.
* **Dismissed:** shows if the user dismissed the carousel/slideout.
* **Goal Completed at:** the date and time when the user completed a defined goal after seeing the carousel/slideout.
## User-level activity table
Below the graph, the User Activity section provides detailed breakdowns at the individual user level, including:
* **Name and ID:** displays the user's name or identifier. Useful for recognizing individual users in the activity list.
* **Shown:** the number of times the carousel/slideout was delivered and displayed to the user.
* **Seen:** the timestamp or time period indicating when the user last received or saw the carousel/slideout.
* **Completed:** indicates whether the user completed all carousel steps or clicked the CTA in the slideout.
* **Dismissed:** shows if the user dismissed the carousel/slideout.
* **Goal Completed at:** the date and time when the user completed a defined goal after seeing the carousel/slideout.
 ## Goal tracking
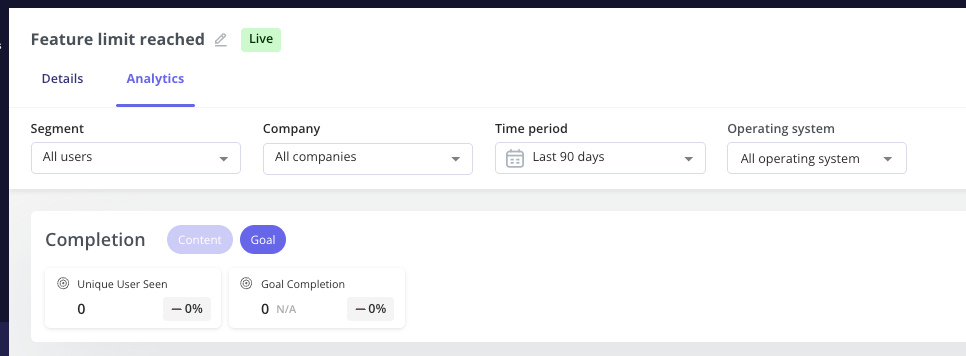
If your mobile content includes a goal (e.g., “Perform an Action”), Userpilot also displays:
**Carousel and slideout**
* **Unique Users Seen** - the number of unique recipients the goal applied to.
* **Goal Completion** - the number of recipients who achieved the defined goal.
**Push notification**
* **Unique Users Sent** - the number of unique recipients the goal applied to.
* **Goal Completion** - the number of recipients who achieved the defined goal.
## Goal tracking
If your mobile content includes a goal (e.g., “Perform an Action”), Userpilot also displays:
**Carousel and slideout**
* **Unique Users Seen** - the number of unique recipients the goal applied to.
* **Goal Completion** - the number of recipients who achieved the defined goal.
**Push notification**
* **Unique Users Sent** - the number of unique recipients the goal applied to.
* **Goal Completion** - the number of recipients who achieved the defined goal.
 [For any questions or concerns please reach out to **support@userpilot.com**](mailto:support@userpilot.com)