> ## Documentation Index
> Fetch the complete documentation index at: https://docs.userpilot.com/llms.txt
> Use this file to discover all available pages before exploring further.
# Feature Engagement
> Understand how users discover, use, convert on, and return to a selected feature—with adoption, usage, retention, and journey reports.
The Feature Engagement dashboard template is only available on Growth and Enterprise plans.
The **Feature Engagement Dashboard** helps you understand how users discover, use, convert, and return to a selected feature. It gives product teams a ready-made dashboard with predefined reports, while still allowing you to add custom reports when needed.
### Description
The Feature Engagement Dashboard provides feature-level insights so you can track how users interact with a specific feature over time. It helps you measure adoption, usage frequency, value moment conversion, retention, and the user journey before and after engaging with the feature.
You can use this dashboard to answer questions such as:
1. Are users discovering this feature?
2. How often are users engaging with it?
3. Are users reaching the feature's value moment?
4. Do users come back to use the feature again?
5. What actions do users take before and after engaging with the feature?
The dashboard also supports global filters, comparison periods, report customization, and drag-and-drop ordering so you can tailor the dashboard to your analysis needs.
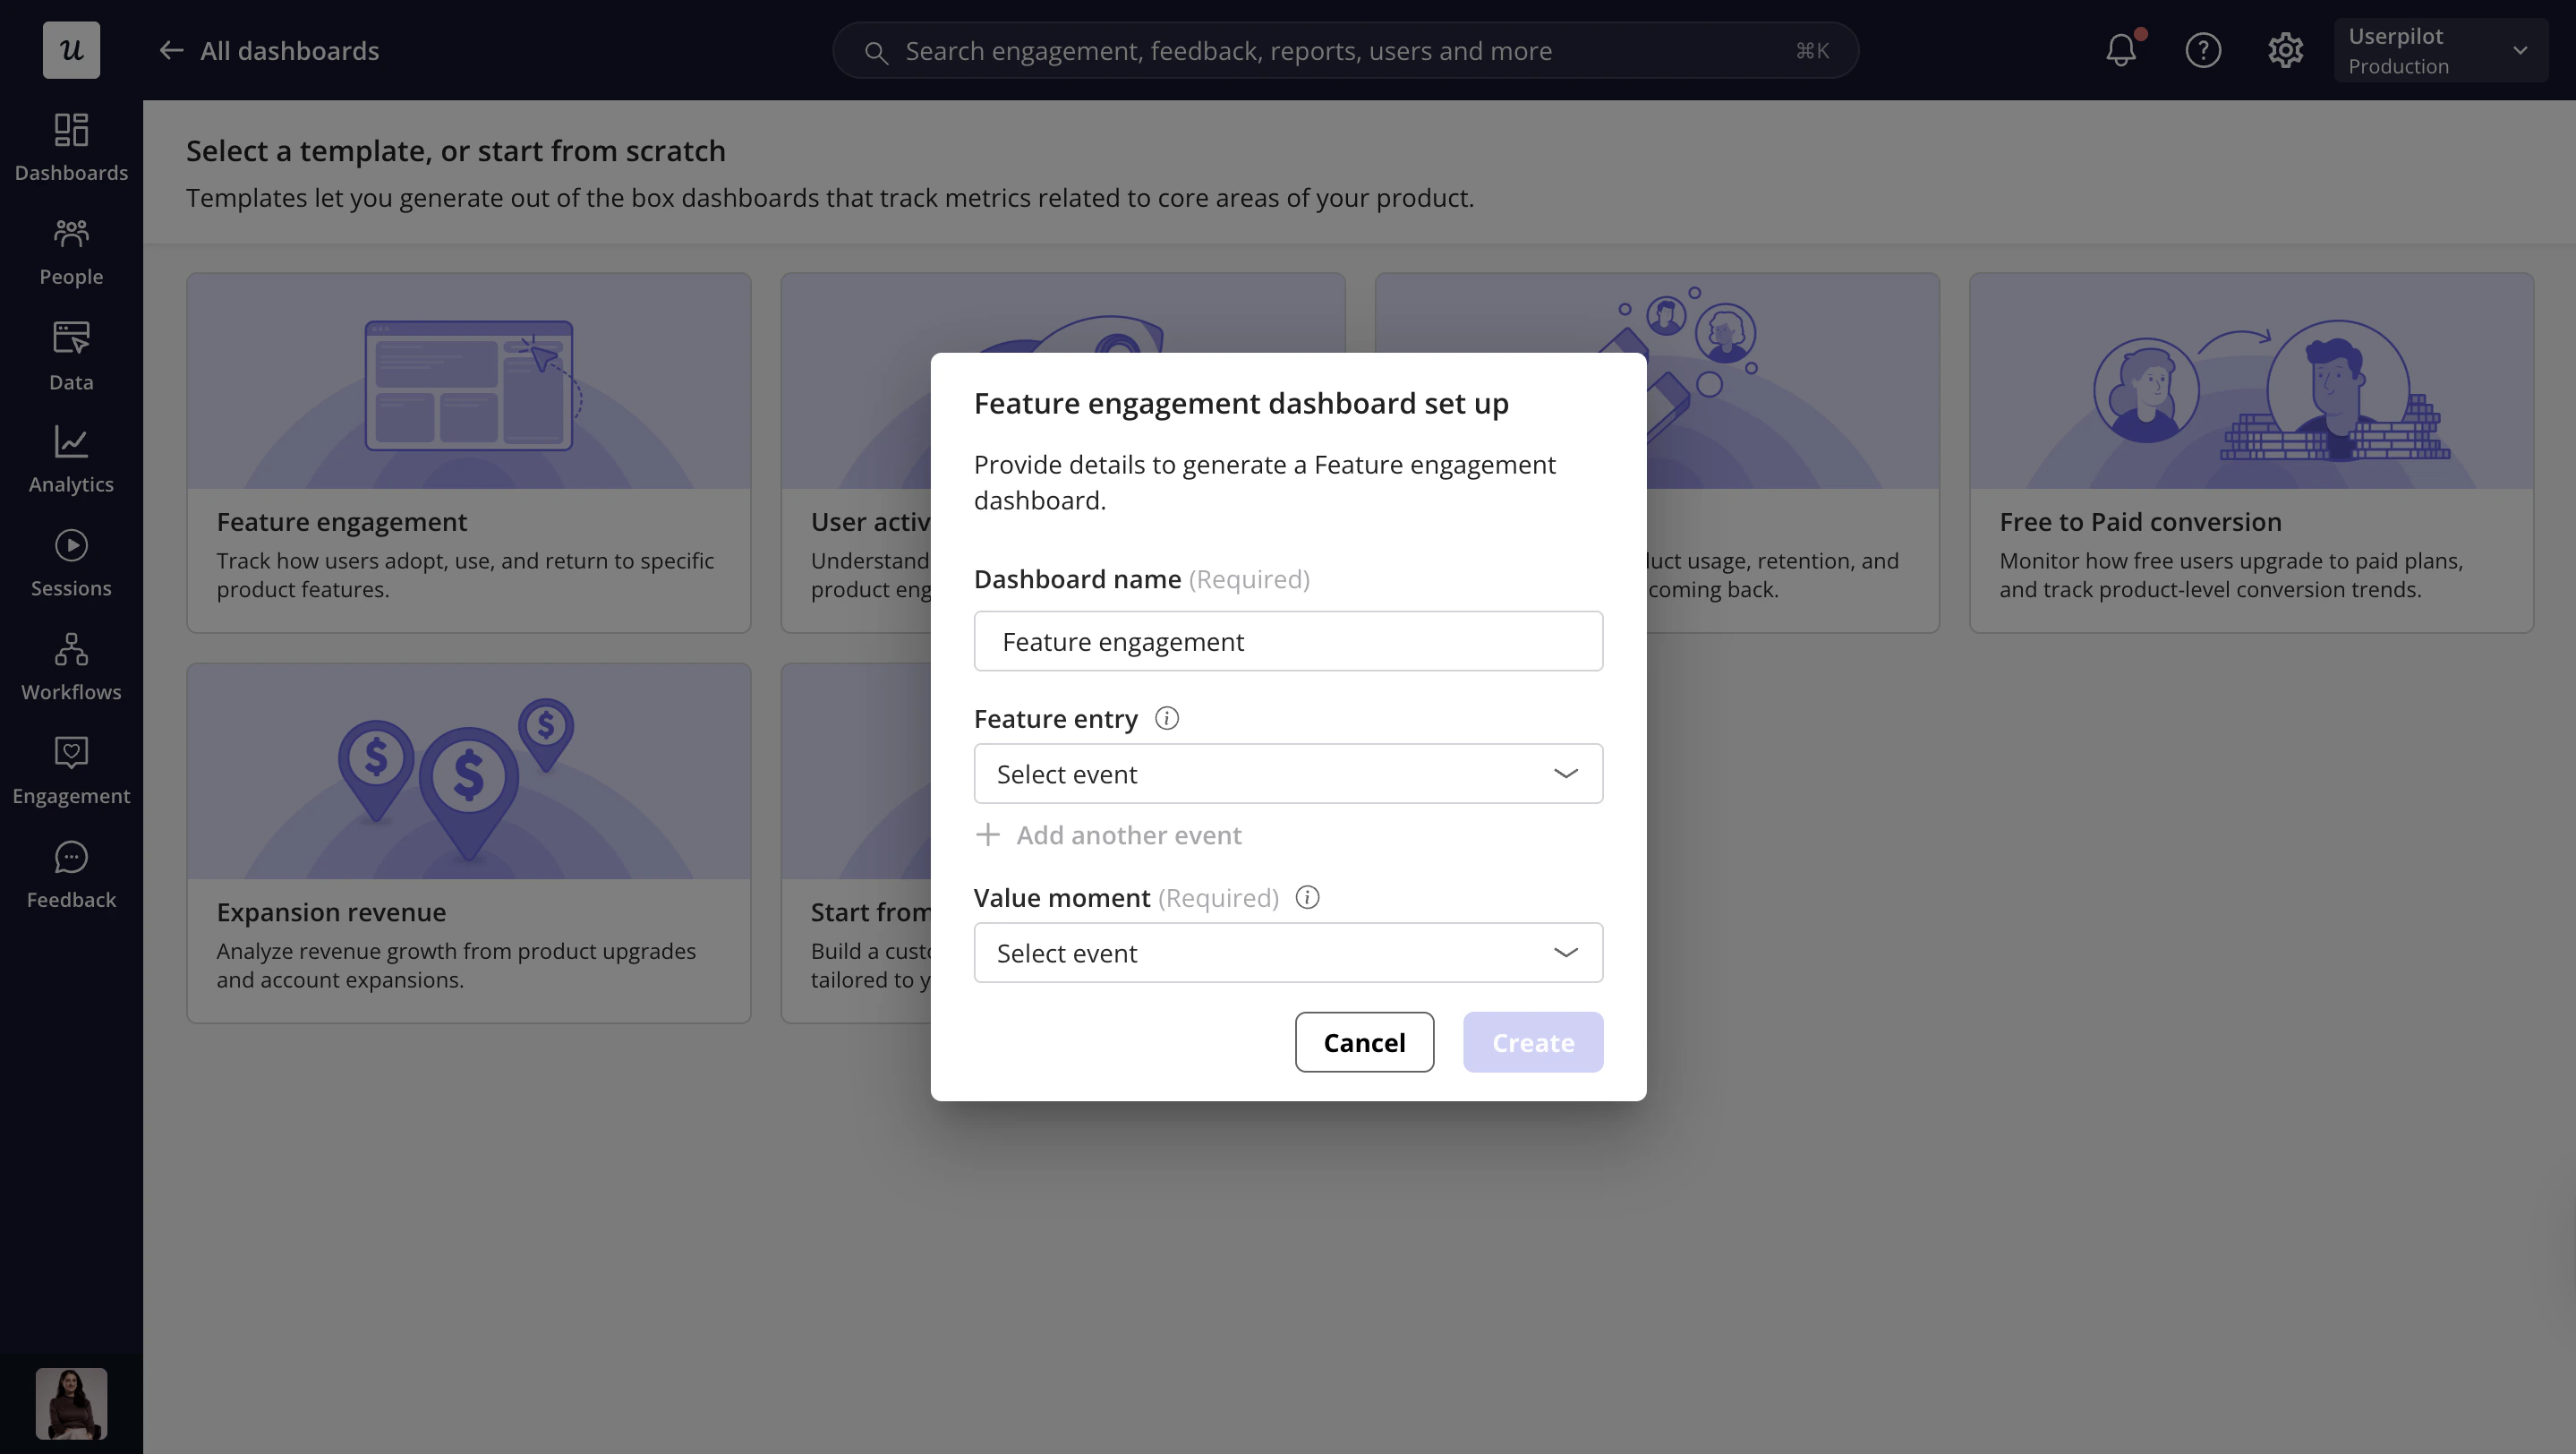
### Create a Feature Engagement dashboard
To create a Feature Engagement Dashboard:
1. Go to **Dashboards**
2. Select **Feature engagement** from the dashboard templates
3. Complete the setup details in the pop-up
4. Click **Create**
### Dashboard setup fields
1. **Dashboard name**
Enter the name of your dashboard. This name is displayed as the dashboard title after creation. You can edit the title later from the dashboard page.
2. **Feature event**
Select the event or events that represent engagement with the feature. By default, this is set to **Any event**. You can select multiple events because engagement with a feature may require users to interact with more than one area of the product.
3. **Value moment**
Select the event that represents the moment when users successfully reach the purpose of the feature. This is the key outcome event used to understand whether users are getting value from the feature.
 ### Report groups and report purposes
The Feature Engagement Dashboard is organized into report groups to help you move from discovery, to usage, to retention, and finally to user journey analysis.
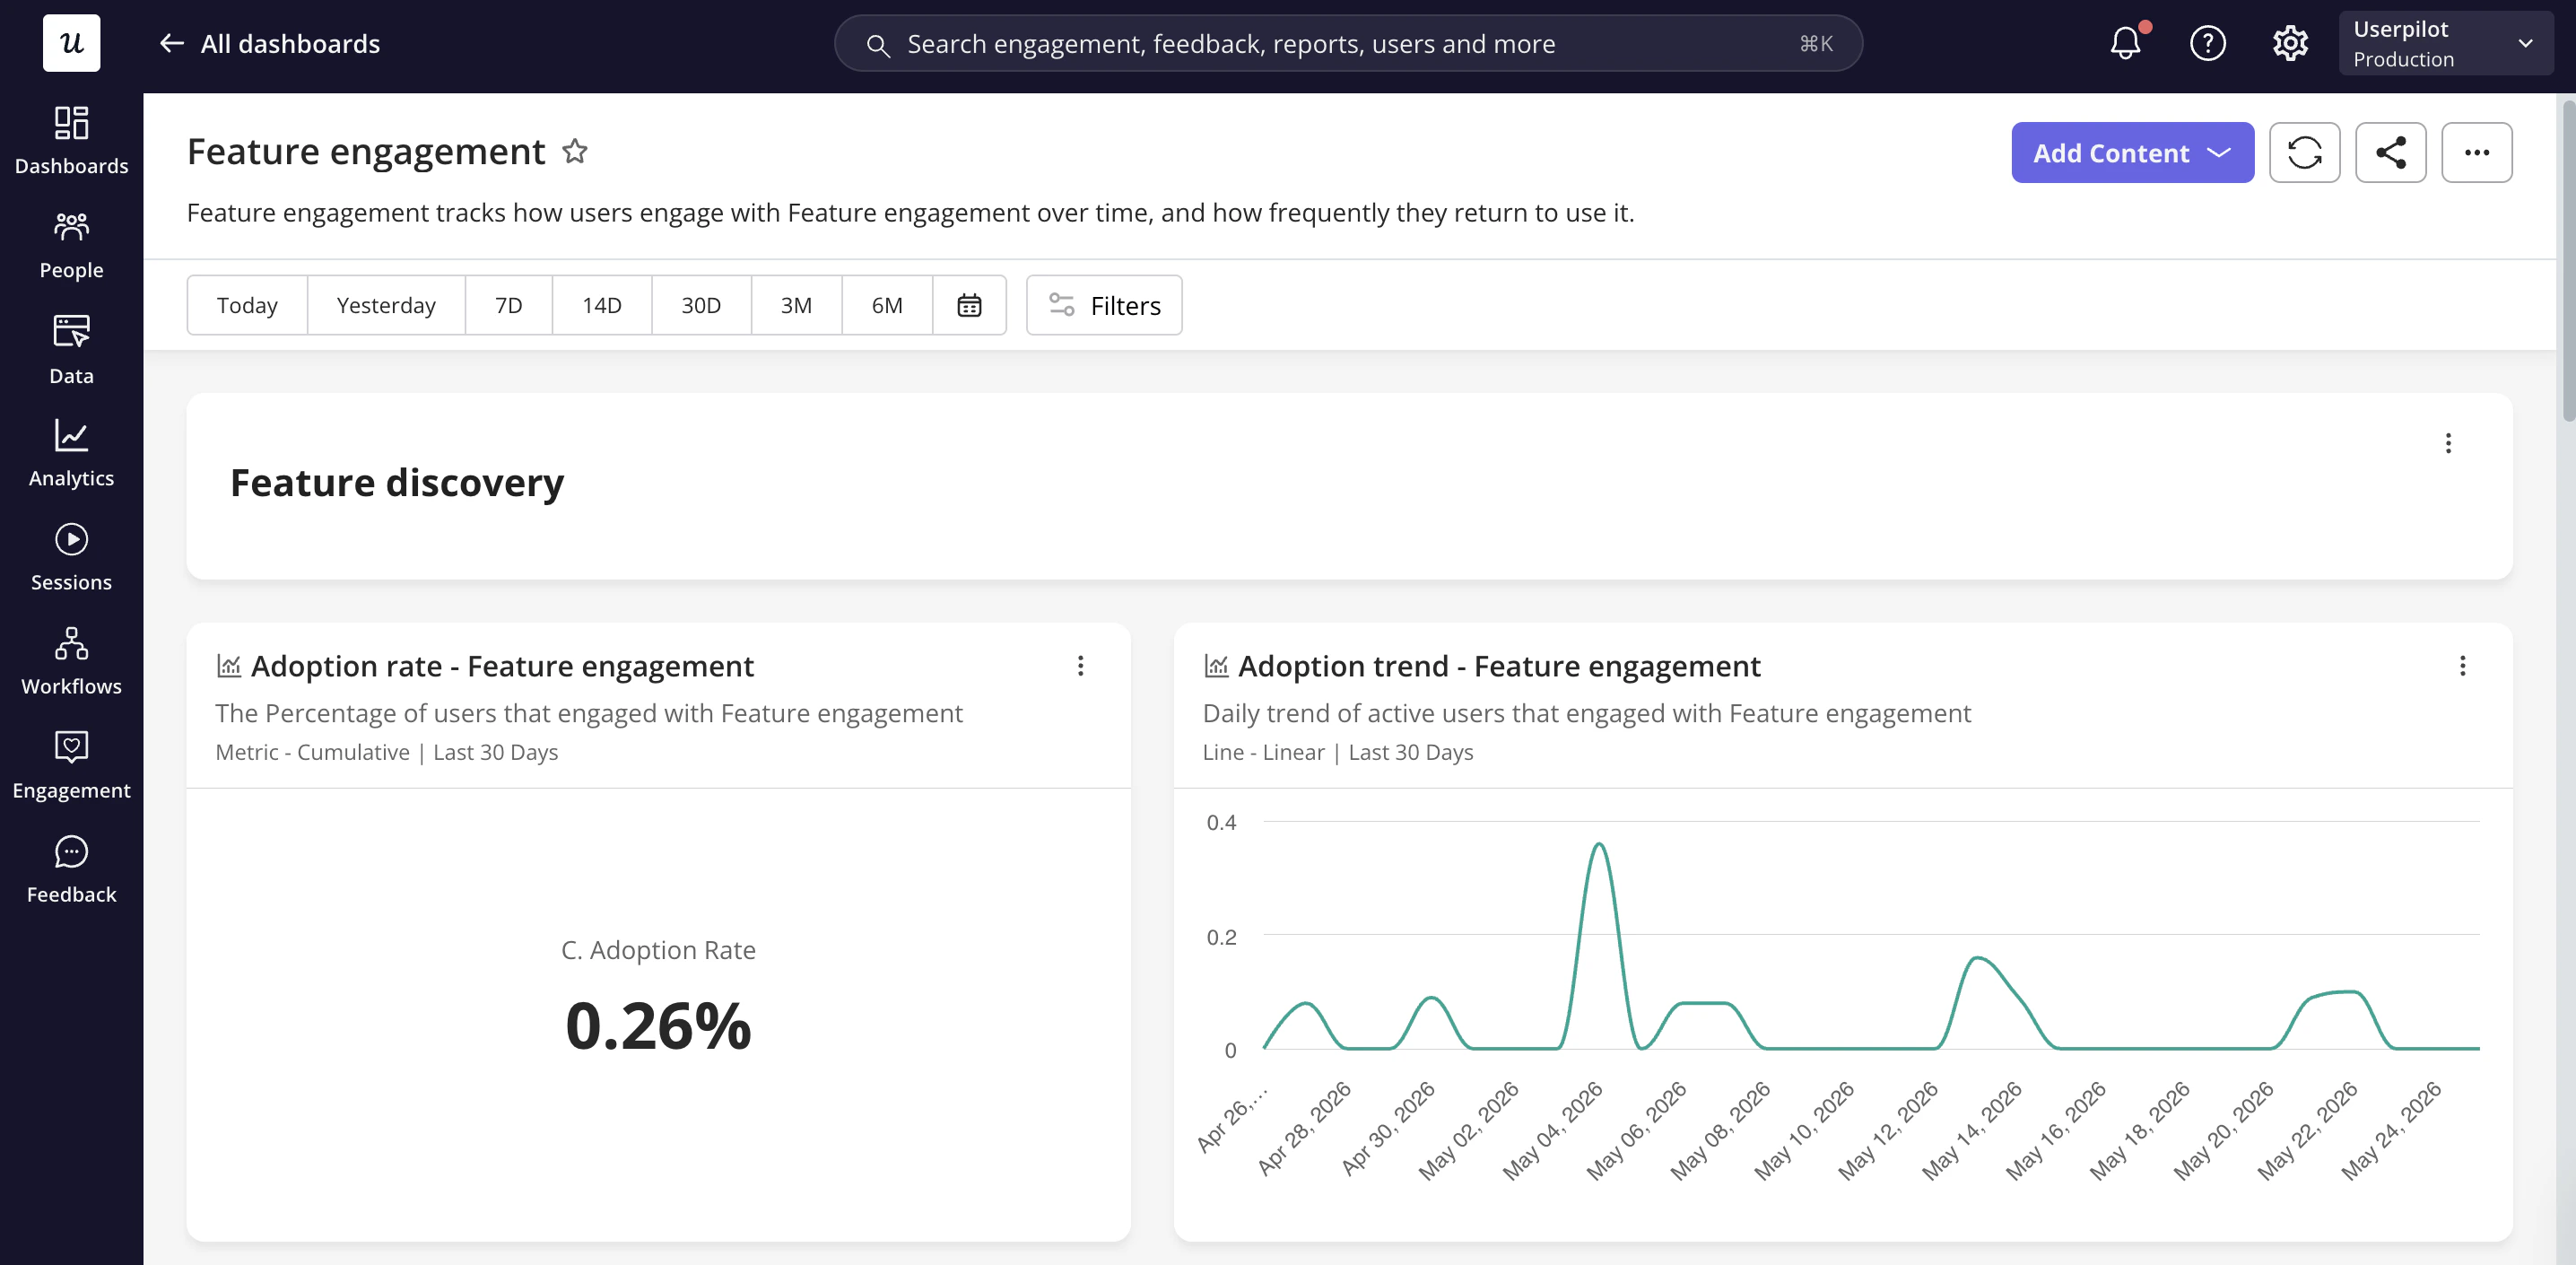
1. **Feature discovery**
Feature discovery reports help you understand whether users are finding and starting to engage with the selected feature.
* **Adoption Rate**
Shows the percentage of users who engaged with the selected feature event. This helps you quickly understand how widely the feature is being adopted across your selected audience.
* **Adoption Trend**
Shows how adoption changes over time. Use this report to identify whether feature discovery is increasing, decreasing, or staying flat after releases, campaigns, onboarding flows, or product changes.
### Report groups and report purposes
The Feature Engagement Dashboard is organized into report groups to help you move from discovery, to usage, to retention, and finally to user journey analysis.
1. **Feature discovery**
Feature discovery reports help you understand whether users are finding and starting to engage with the selected feature.
* **Adoption Rate**
Shows the percentage of users who engaged with the selected feature event. This helps you quickly understand how widely the feature is being adopted across your selected audience.
* **Adoption Trend**
Shows how adoption changes over time. Use this report to identify whether feature discovery is increasing, decreasing, or staying flat after releases, campaigns, onboarding flows, or product changes.
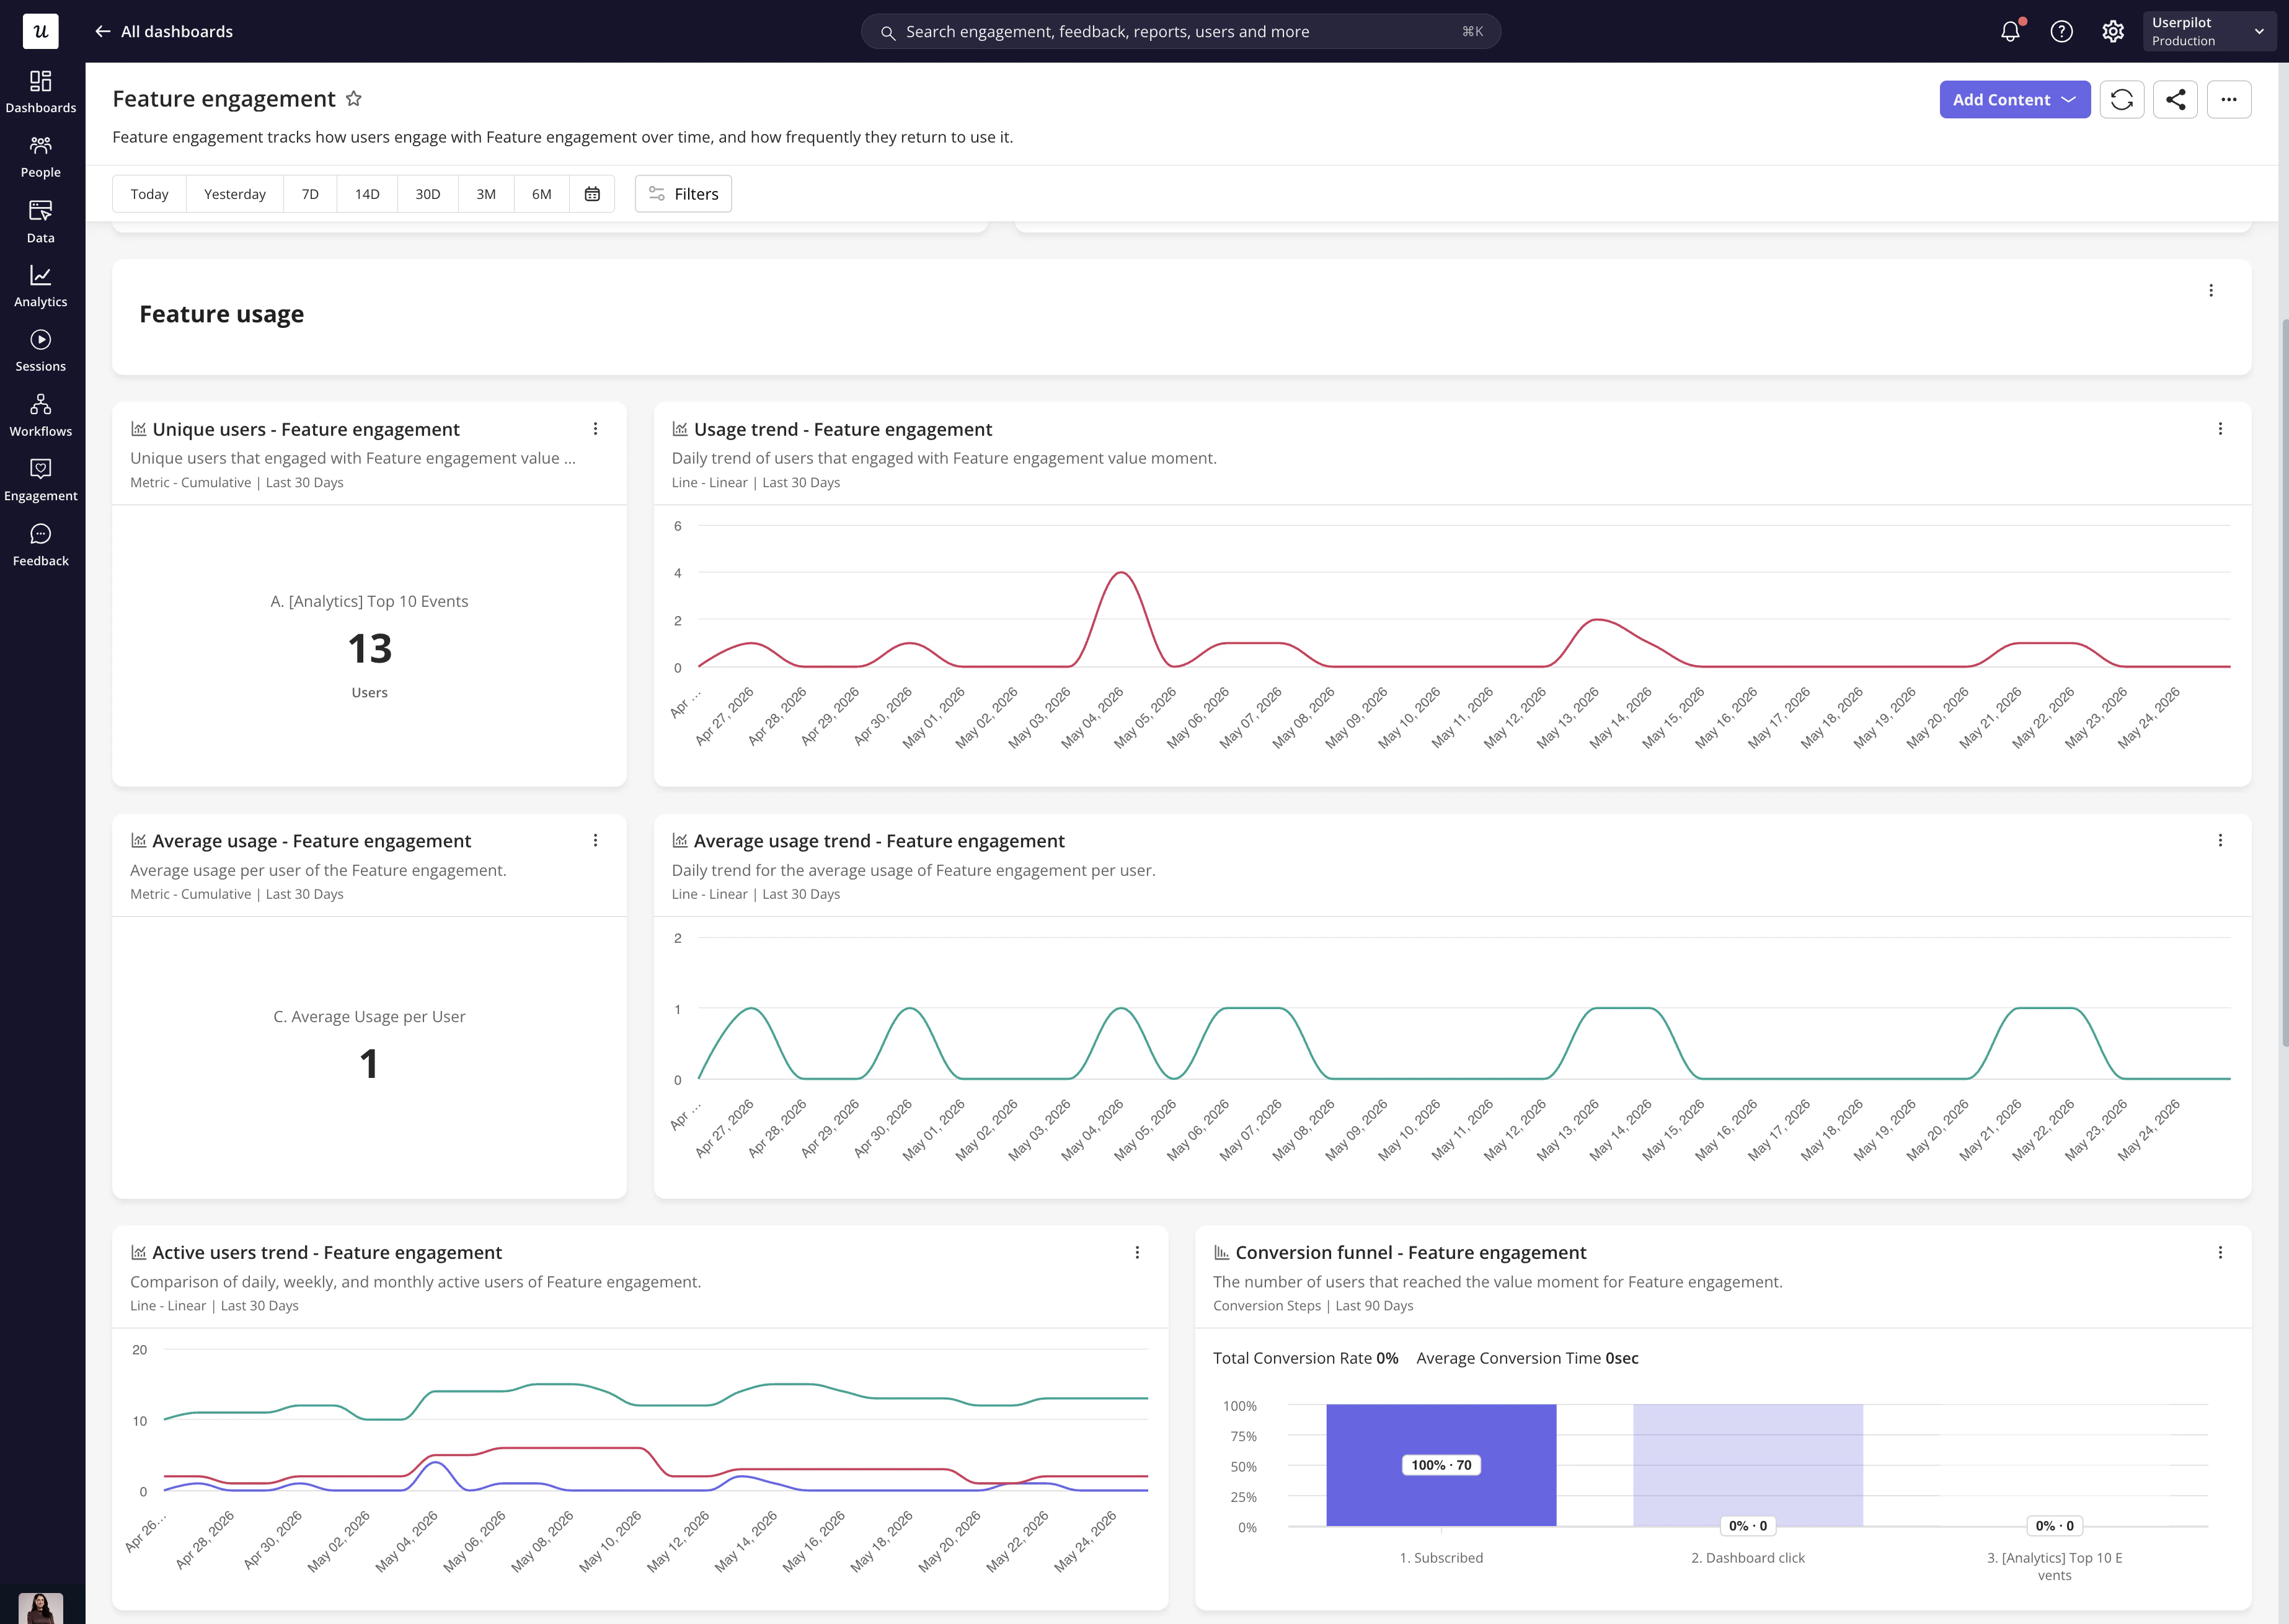
 2. **Feature usage**
Feature usage reports help you understand how deeply and frequently users interact with the selected feature.
* **Unique Users**
Shows the number of users who engaged with the feature value moment. This helps you measure the actual reach of the feature among users.
* **Usage Trend**
Shows the daily trend of users engaging with the selected value moment. Use this report to spot spikes, drops, or changes in usage behavior over time.
* **Average Usage**
Shows the average usage per user for the selected feature. This helps you understand whether users are engaging once or repeatedly using the feature.
* **Average Usage Trend**
Shows how average usage changes over time. Use this report to understand whether engagement depth is improving or declining.
* **Active Users Trend**
Shows the trend of daily, weekly, and monthly active users for the selected feature. Use it to understand how consistently users return to the feature across different activity windows.
* **Conversion Funnel**
Shows how users move between selected feature events until they reach the value moment. The funnel displays each selected event as a step, including conversion rates and the time between steps. Use this report to identify where users drop off before reaching the feature's value moment.
2. **Feature usage**
Feature usage reports help you understand how deeply and frequently users interact with the selected feature.
* **Unique Users**
Shows the number of users who engaged with the feature value moment. This helps you measure the actual reach of the feature among users.
* **Usage Trend**
Shows the daily trend of users engaging with the selected value moment. Use this report to spot spikes, drops, or changes in usage behavior over time.
* **Average Usage**
Shows the average usage per user for the selected feature. This helps you understand whether users are engaging once or repeatedly using the feature.
* **Average Usage Trend**
Shows how average usage changes over time. Use this report to understand whether engagement depth is improving or declining.
* **Active Users Trend**
Shows the trend of daily, weekly, and monthly active users for the selected feature. Use it to understand how consistently users return to the feature across different activity windows.
* **Conversion Funnel**
Shows how users move between selected feature events until they reach the value moment. The funnel displays each selected event as a step, including conversion rates and the time between steps. Use this report to identify where users drop off before reaching the feature's value moment.
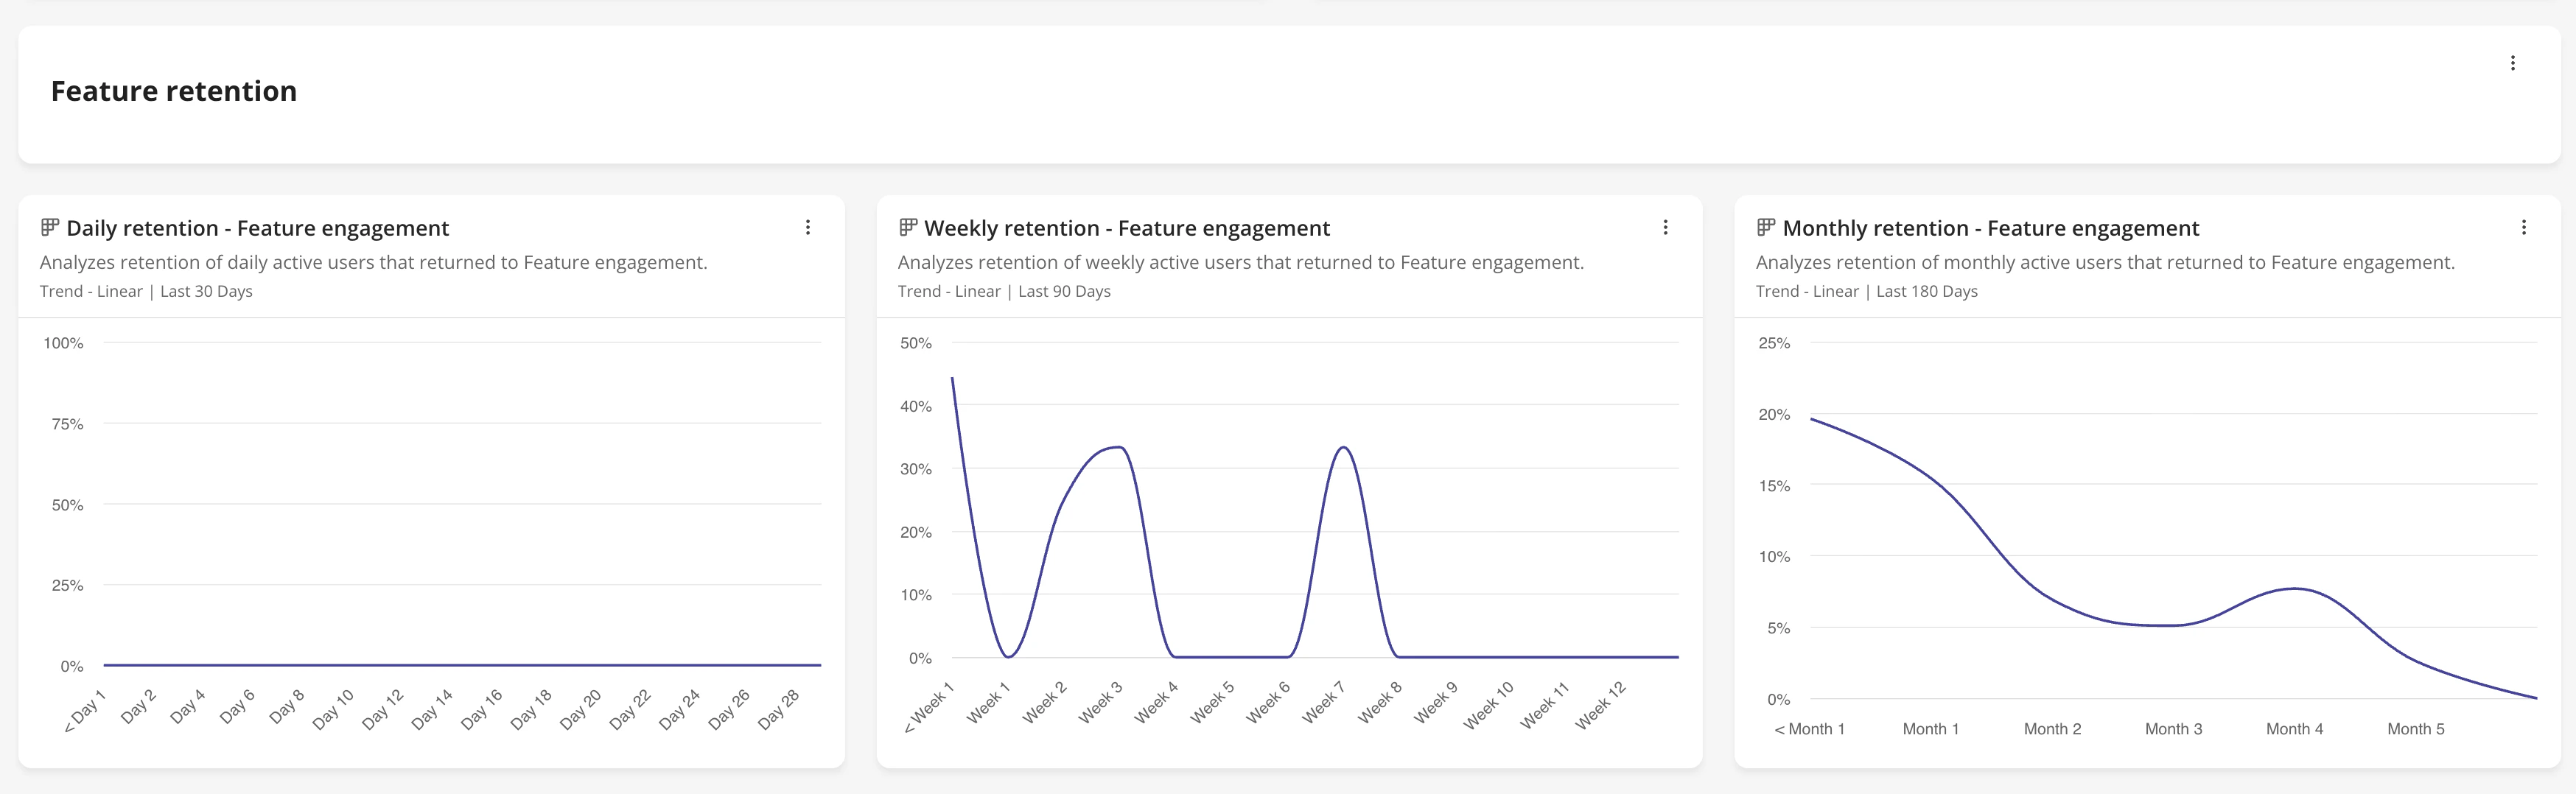
 3. **Feature retention**
Feature retention reports help you understand whether users return to the feature after using it.
* **Daily Retention**
Shows how many users return to the feature on a daily basis. Use this to understand short-term repeat usage and immediate engagement after the first interaction.
* **Weekly Retention**
Shows how many users return to the feature week over week. Use this to understand whether the feature becomes part of users' weekly workflow.
* **Monthly Retention**
Shows how many users return to the feature month over month. Use this to understand long-term engagement and whether the feature continues to deliver value over time.
3. **Feature retention**
Feature retention reports help you understand whether users return to the feature after using it.
* **Daily Retention**
Shows how many users return to the feature on a daily basis. Use this to understand short-term repeat usage and immediate engagement after the first interaction.
* **Weekly Retention**
Shows how many users return to the feature week over week. Use this to understand whether the feature becomes part of users' weekly workflow.
* **Monthly Retention**
Shows how many users return to the feature month over month. Use this to understand long-term engagement and whether the feature continues to deliver value over time.
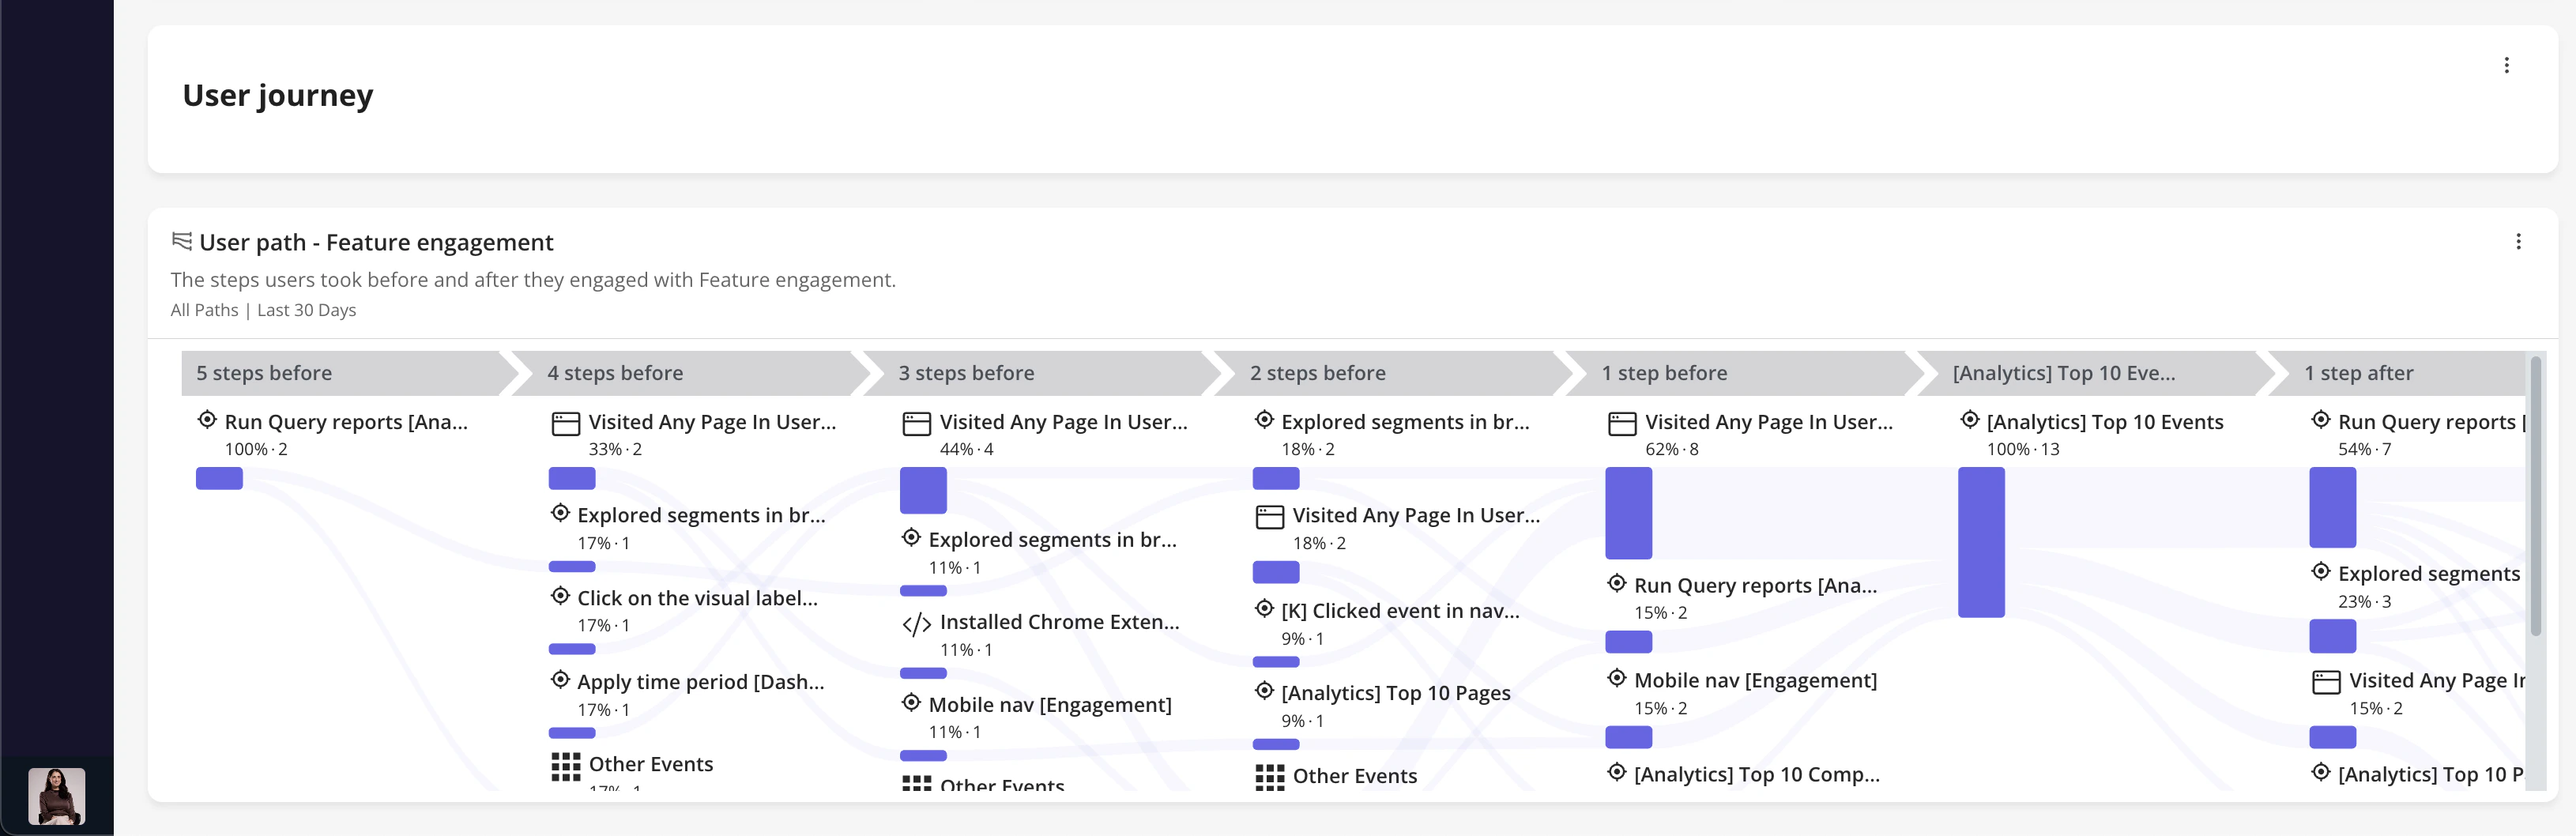
 4. **User journey**
User journey reports help you understand what users do before and after engaging with the feature.
* **User Path Before/After**
Shows the steps users take before and after interacting with the selected feature events. Use this report to understand the user journey around the feature, identify common paths, and discover opportunities to improve guidance or onboarding.
4. **User journey**
User journey reports help you understand what users do before and after engaging with the feature.
* **User Path Before/After**
Shows the steps users take before and after interacting with the selected feature events. Use this report to understand the user journey around the feature, identify common paths, and discover opportunities to improve guidance or onboarding.
 ### Report card behavior
Each report card is designed to support quick exploration and deeper analysis.
The report title is clickable and opens the detailed report view. Users can also reorder reports using drag and drop, allowing them to personalize the dashboard based on their workflow and priorities.
For Trend, Funnel, and Retention reports, a table view icon is available. When clicked, it shows a breakdown table for the selected events.
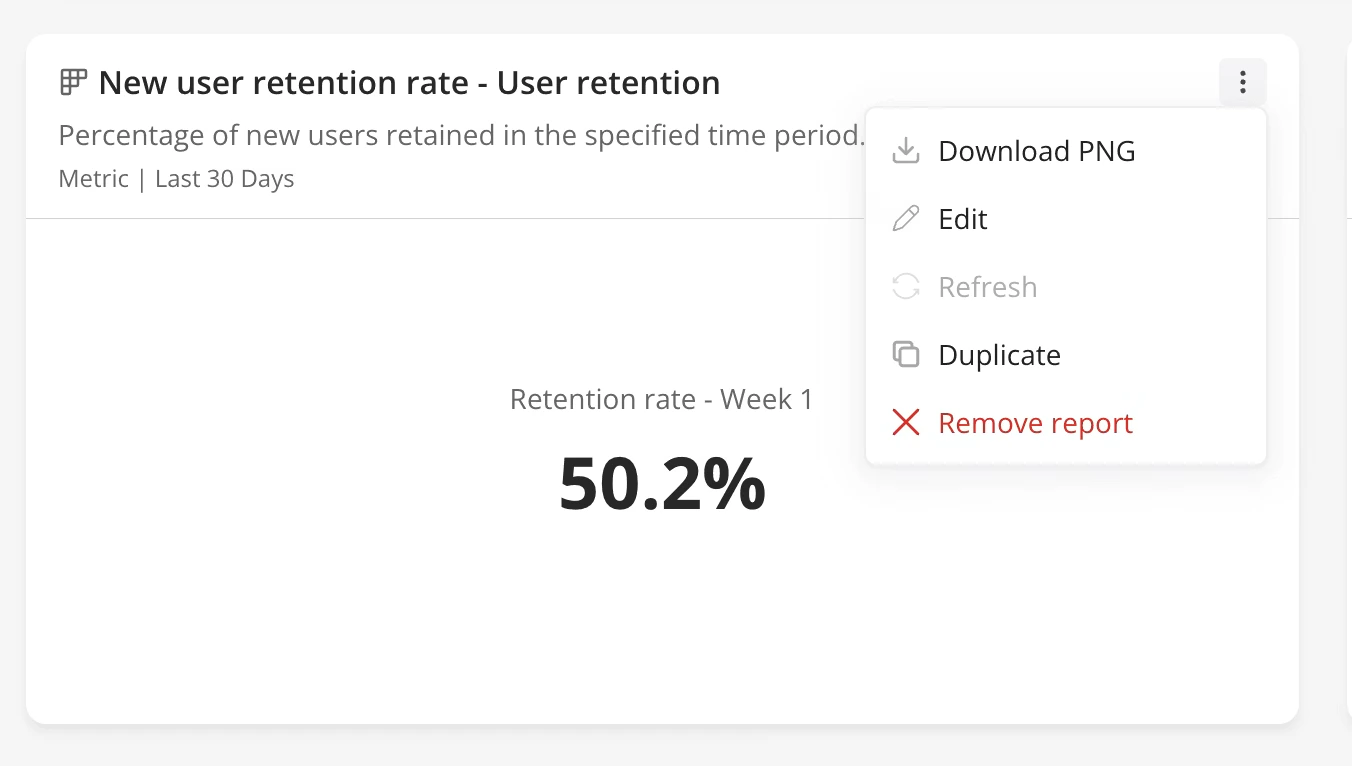
Each report action menu includes:
* **Download as PNG**
* **Edit**
* **Refresh**
* **Duplicate**
* **Remove report**
### Report card behavior
Each report card is designed to support quick exploration and deeper analysis.
The report title is clickable and opens the detailed report view. Users can also reorder reports using drag and drop, allowing them to personalize the dashboard based on their workflow and priorities.
For Trend, Funnel, and Retention reports, a table view icon is available. When clicked, it shows a breakdown table for the selected events.
Each report action menu includes:
* **Download as PNG**
* **Edit**
* **Refresh**
* **Duplicate**
* **Remove report**
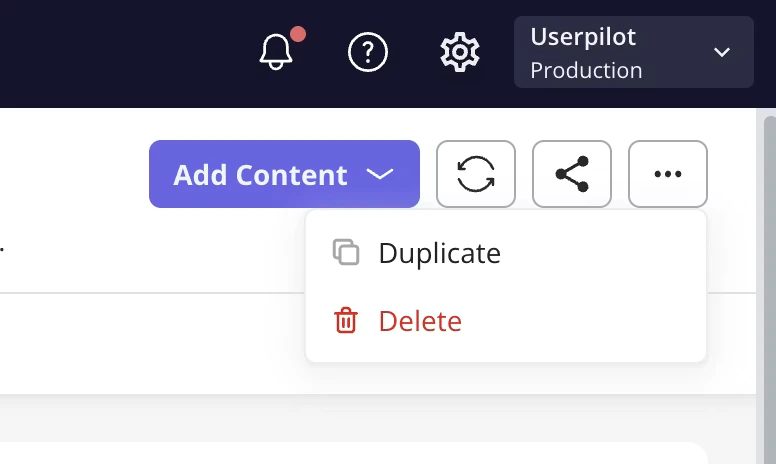
 ### Dashboard actions
Within the header, you can:
* **Add content:** You can add an existing report to the dashboard or create a new report and add it directly.
* **Share:** Use the three dots in the top-right corner to share the dashboard via email with teammates.
* **Refresh:** Click the refresh icon in the top-right corner to update the dashboard data (available every 10 minutes).
* **Action menu:** Duplicate and delete.
### Dashboard actions
Within the header, you can:
* **Add content:** You can add an existing report to the dashboard or create a new report and add it directly.
* **Share:** Use the three dots in the top-right corner to share the dashboard via email with teammates.
* **Refresh:** Click the refresh icon in the top-right corner to update the dashboard data (available every 10 minutes).
* **Action menu:** Duplicate and delete.
 ### Dashboard filters
* **Add filters:** Narrow the dashboard data to focus on a specific group of users by applying user properties, company properties, or segments.
* **Time period:** Select a specific time range for the data displayed in the dashboard.
* **Platform *(Mobile only):*** If Mobile is enabled in your account, choose to display data from all platforms, web only, or mobile only.
### Dashboard filters
* **Add filters:** Narrow the dashboard data to focus on a specific group of users by applying user properties, company properties, or segments.
* **Time period:** Select a specific time range for the data displayed in the dashboard.
* **Platform *(Mobile only):*** If Mobile is enabled in your account, choose to display data from all platforms, web only, or mobile only.