> ## Documentation Index
> Fetch the complete documentation index at: https://docs.userpilot.com/llms.txt
> Use this file to discover all available pages before exploring further.
# Workflow performance analytics
> Workflow and Content analytics provide visibility into how users move through your workflows, helping you measure performance, identify drop-offs, and optimize outcomes. Here you can find high-level metrics and detailed user-level data so that you can understand engagement, completion, and goal achievement across the entire journey.
## Workflow Analytics
The Workflow analytics page gives you a comprehensive view of how your workflow is performing, from overall adoption and engagement trends to individual user progress. It helps you measure effectiveness, monitor outcomes, and identify opportunities to optimize your workflow experience.
### Key metrics
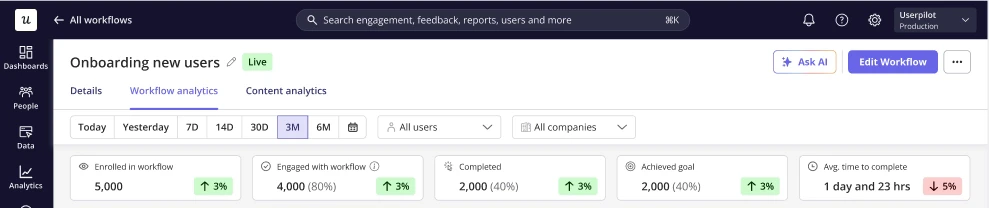
* **Enrolled in workflow** — Total number of users who are eligible to enter the workflow.
* **Engaged with workflow** — Total number of users who interacted with at least one piece of content within the workflow.
* **Completed** — Users who reached the exit of the workflow.
* **Achieved goal** — Users who met the defined workflow goal.
* **Avg. time to complete** — The average time taken from enrollment to completion.
Each metric includes trend indicators to show changes compared to the previous period.
 ### Performance chart
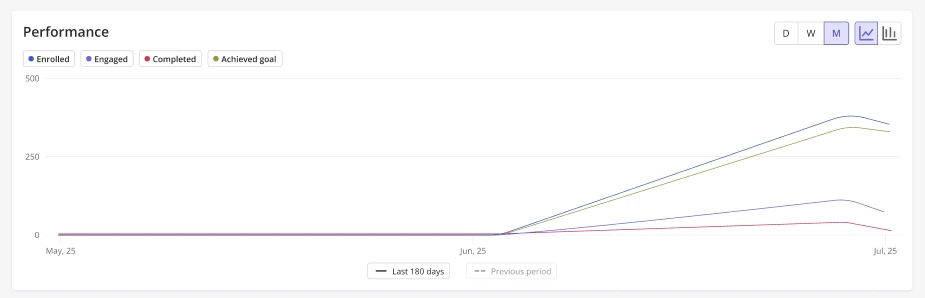
The performance chart visualizes how users progress through the workflow over time. You can see trends for:
* Enrollments
* Engagement
* Completions
* Goal achievement
### Performance chart
The performance chart visualizes how users progress through the workflow over time. You can see trends for:
* Enrollments
* Engagement
* Completions
* Goal achievement
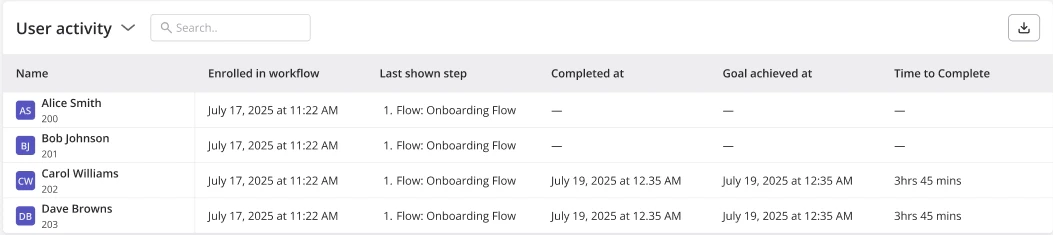
 The User activity table provides a detailed, user-level view of workflow participation.
* **Name** — User name and ID
* **Enrolled in workflow** — When the user became eligible to enter the workflow
* **Last shown step** — The most recent step the user saw
* **Completed at** — Timestamp of workflow completion (if applicable)
* **Goal achieved at** — When the workflow goal was met
* **Time to complete** — Total duration from enrollment to completion
The Company activity table provides a detailed company-level view of workflow participation.
* **Name** - Company name and ID
* **Total enrolled** - Count of unique users from company enrolled in the workflow
* **Last enrollment** - Timestamp of most recent enrollment
* **Total completed** - Count of unique user from company who completed the workflow
* **Last completed** - Timestamp of most recent completion
* **Last goal achieved at** - Timestamp of most recent goal achievementContent Analytics Content analytics show how users interact with the individual content steps inside your workflow. This page helps you understand which experiences are being reached, triggered, and contributing to goal completion so you can evaluate effectiveness at the step level.
### Workflow Content table
The main table displays performance metrics for each content step in the workflow.
* **Step** — The name of the content within the workflow step.
* **Reached step** — The number of users who arrived at that step in the workflow.
* **Content triggered** — How many users were shown the content at that step.
* **Achieved workflow goal** — The number and percentage of users who went on to achieve the workflow goal after reaching that step.
The User activity table provides a detailed, user-level view of workflow participation.
* **Name** — User name and ID
* **Enrolled in workflow** — When the user became eligible to enter the workflow
* **Last shown step** — The most recent step the user saw
* **Completed at** — Timestamp of workflow completion (if applicable)
* **Goal achieved at** — When the workflow goal was met
* **Time to complete** — Total duration from enrollment to completion
The Company activity table provides a detailed company-level view of workflow participation.
* **Name** - Company name and ID
* **Total enrolled** - Count of unique users from company enrolled in the workflow
* **Last enrollment** - Timestamp of most recent enrollment
* **Total completed** - Count of unique user from company who completed the workflow
* **Last completed** - Timestamp of most recent completion
* **Last goal achieved at** - Timestamp of most recent goal achievementContent Analytics Content analytics show how users interact with the individual content steps inside your workflow. This page helps you understand which experiences are being reached, triggered, and contributing to goal completion so you can evaluate effectiveness at the step level.
### Workflow Content table
The main table displays performance metrics for each content step in the workflow.
* **Step** — The name of the content within the workflow step.
* **Reached step** — The number of users who arrived at that step in the workflow.
* **Content triggered** — How many users were shown the content at that step.
* **Achieved workflow goal** — The number and percentage of users who went on to achieve the workflow goal after reaching that step.
 ## Content Analytics
Content analytics show how users interact with the individual content steps inside your workflow. This page helps you understand which experiences are being reached, triggered, and contributing to goal completion so you can evaluate effectiveness at the step level.
### Workflow Content table
The main table displays performance metrics for each content step in the workflow.
* **Step** — The name of the content within the workflow step.
* **Reached step** — The number of users who arrived at that step in the workflow.
* **Content triggered** — How many users were shown the content at that step.
* **Achieved workflow goal** — The number and percentage of users who went on to achieve the workflow goal after reaching that step.
## Content Analytics
Content analytics show how users interact with the individual content steps inside your workflow. This page helps you understand which experiences are being reached, triggered, and contributing to goal completion so you can evaluate effectiveness at the step level.
### Workflow Content table
The main table displays performance metrics for each content step in the workflow.
* **Step** — The name of the content within the workflow step.
* **Reached step** — The number of users who arrived at that step in the workflow.
* **Content triggered** — How many users were shown the content at that step.
* **Achieved workflow goal** — The number and percentage of users who went on to achieve the workflow goal after reaching that step.
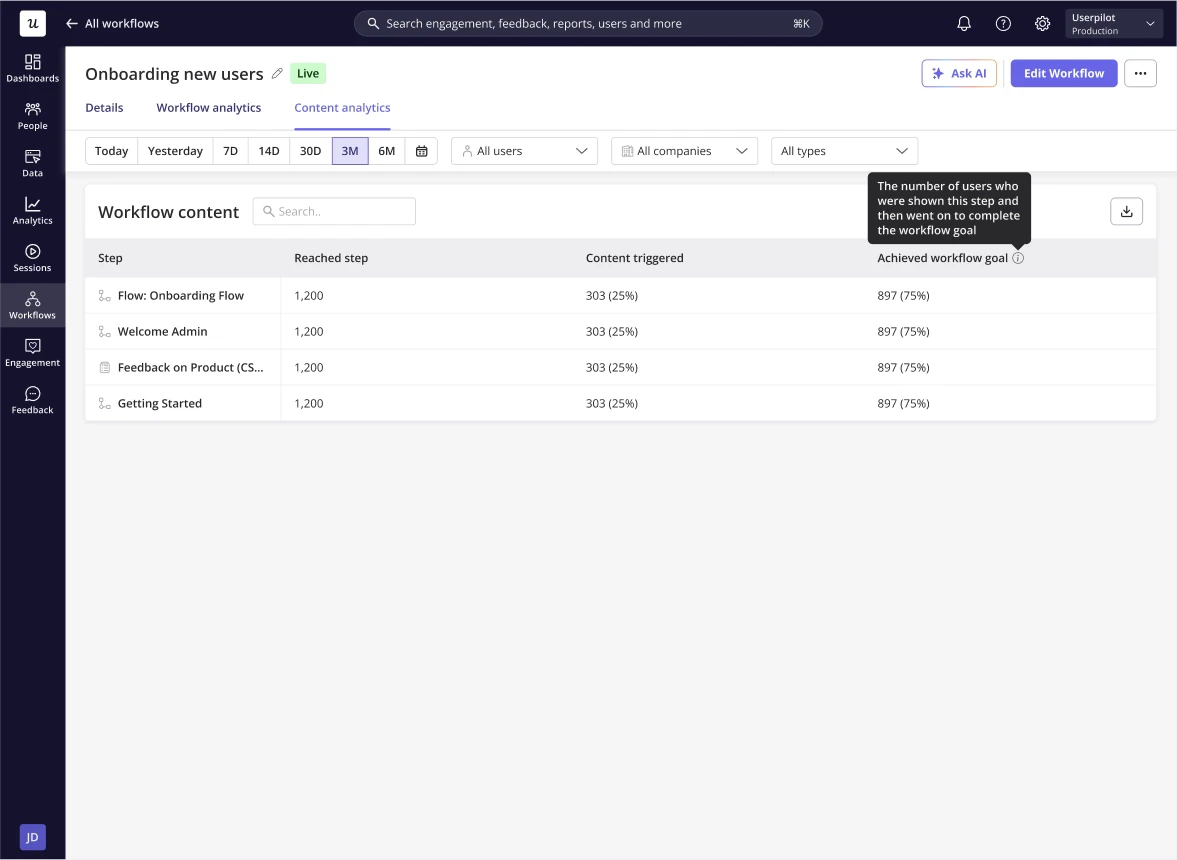 Each step is clickable and opens a detailed view of that content, where you can explore all analytics associated with that specific content type.