Overview
To make data-driven decisions, it is important to understand the impact of your users’ interactions and in-app flows on your growth goals and feature adoption. Userpilot allows you to track your users’ behavior in your app in real-time and provides multiple ways to track users’ interactions (technical and non-technical) by labeling and tracking events within your product, offering a comprehensive view of its usage.There is a 25 total event limit on Starter plans
Use Cases
- Track users’ activity and understand what features they are interacting with
- Trigger content based on user behavior
- Identify where your users are spending their time on your product
- Get an intuitive view of your feature usage
- Defining a goal using an event to measure the impact of your in-flows on user behavior
Event Types
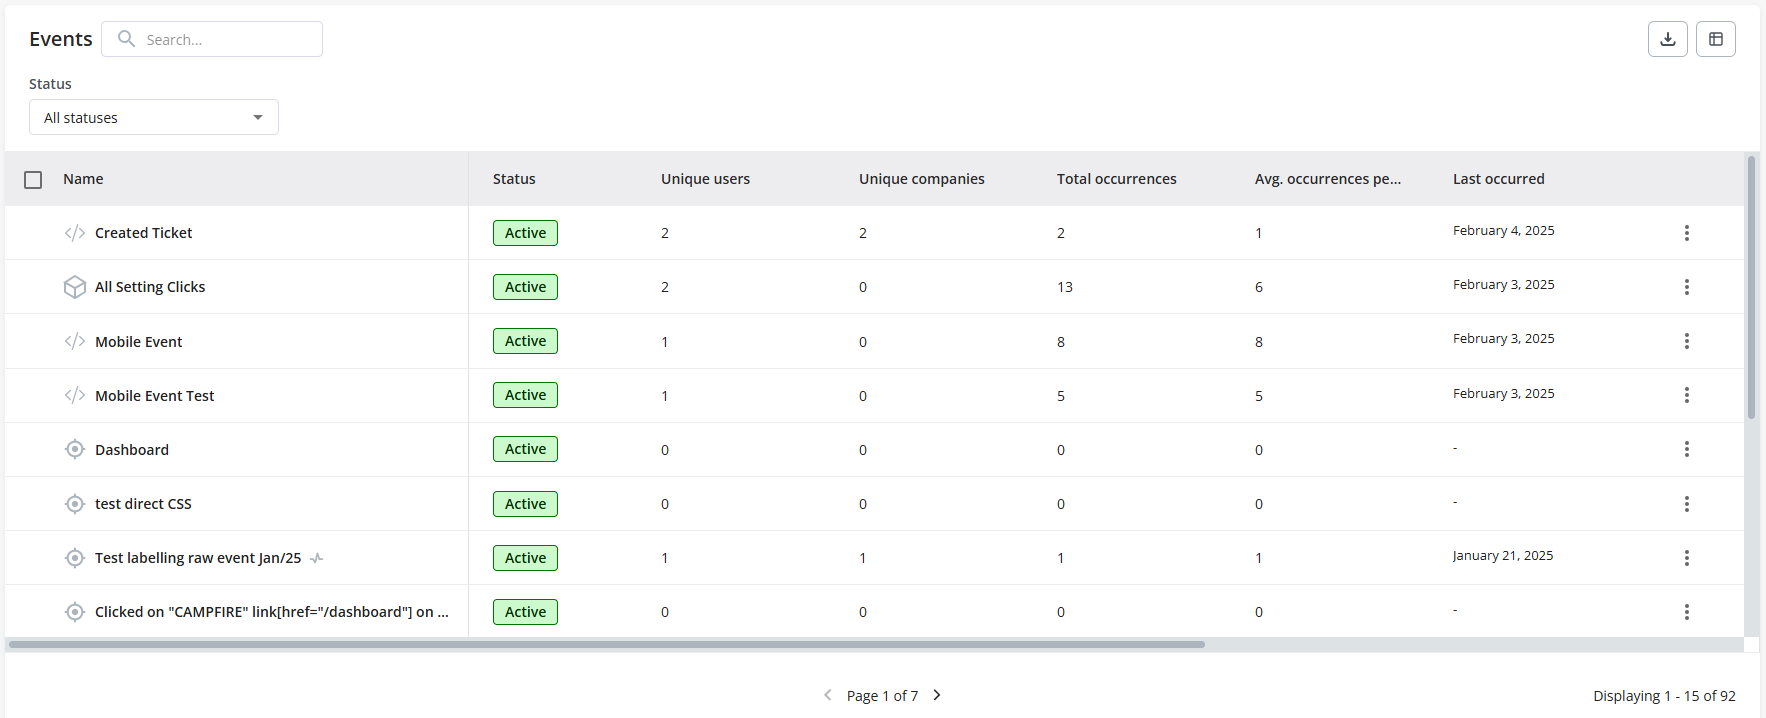
All event types can track user interactions that consist of Clicks, Text Inputs, Form Submissions, or even Backend Events. Those events will show in the Events table and have different icons for easier differentiation.- Labeled Events: Create an event using Userpilot without technical interference, either using the Visual Labeler or directly adding the CSS Selectors.
- Tracked Events: Events can be added by calling the tracking method in your code. This option is available for both web and mobile applications, as it allows sending metadata (event properties) and can include backend events.
- Custom Events: A combination of events, with custom events you can select multiple events created previously and merge them into one new event.
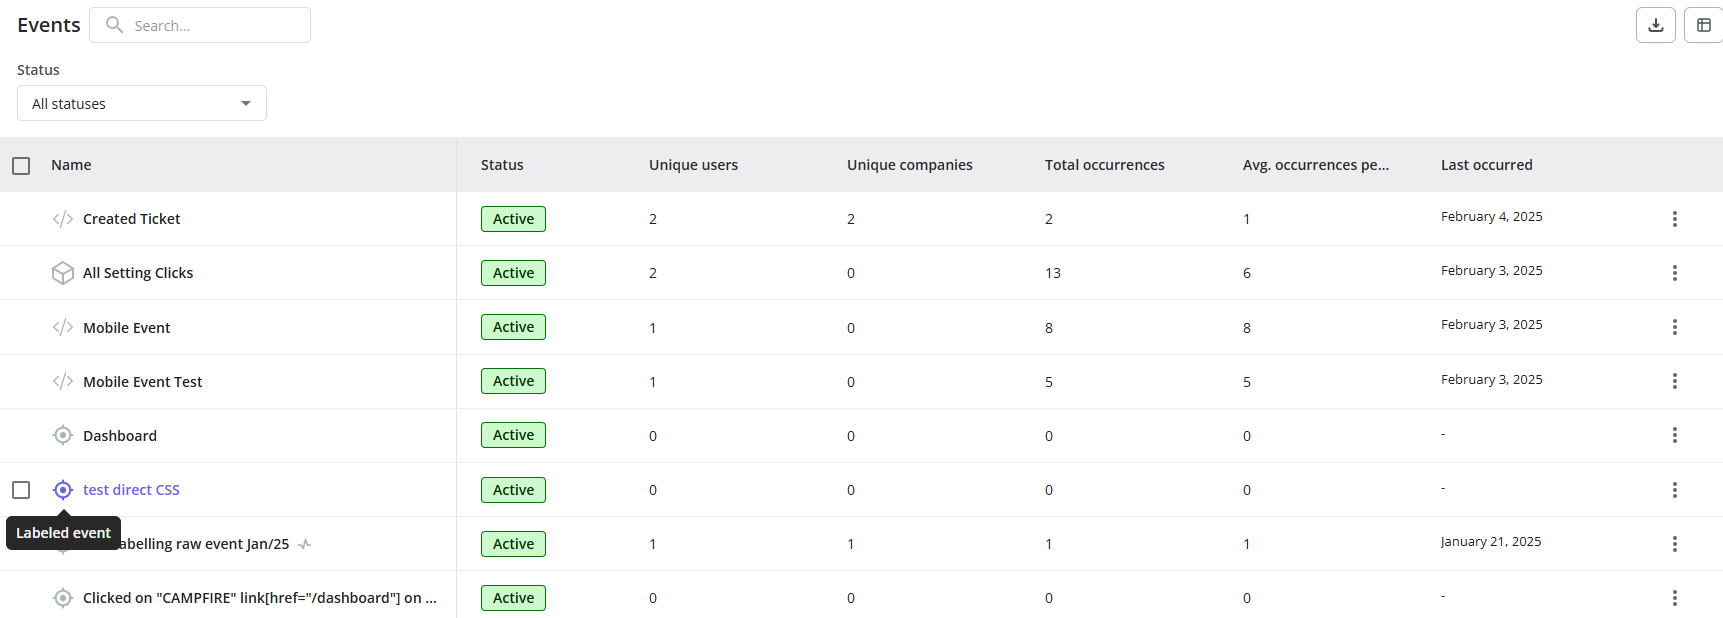
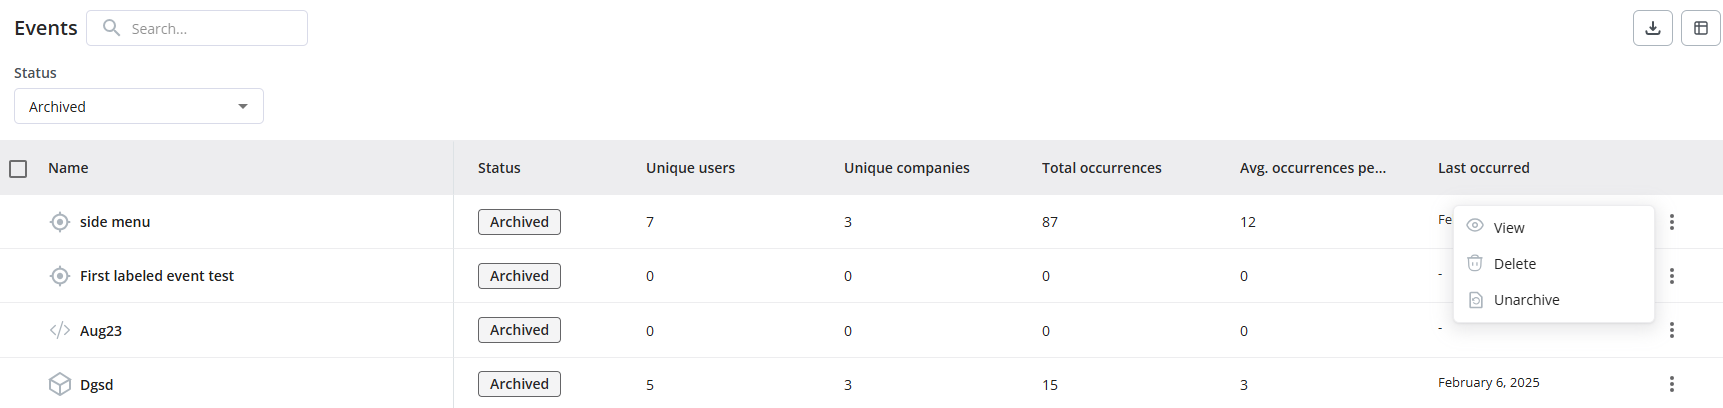
All statuses doesn’t include Archived by default
Event Dashboards
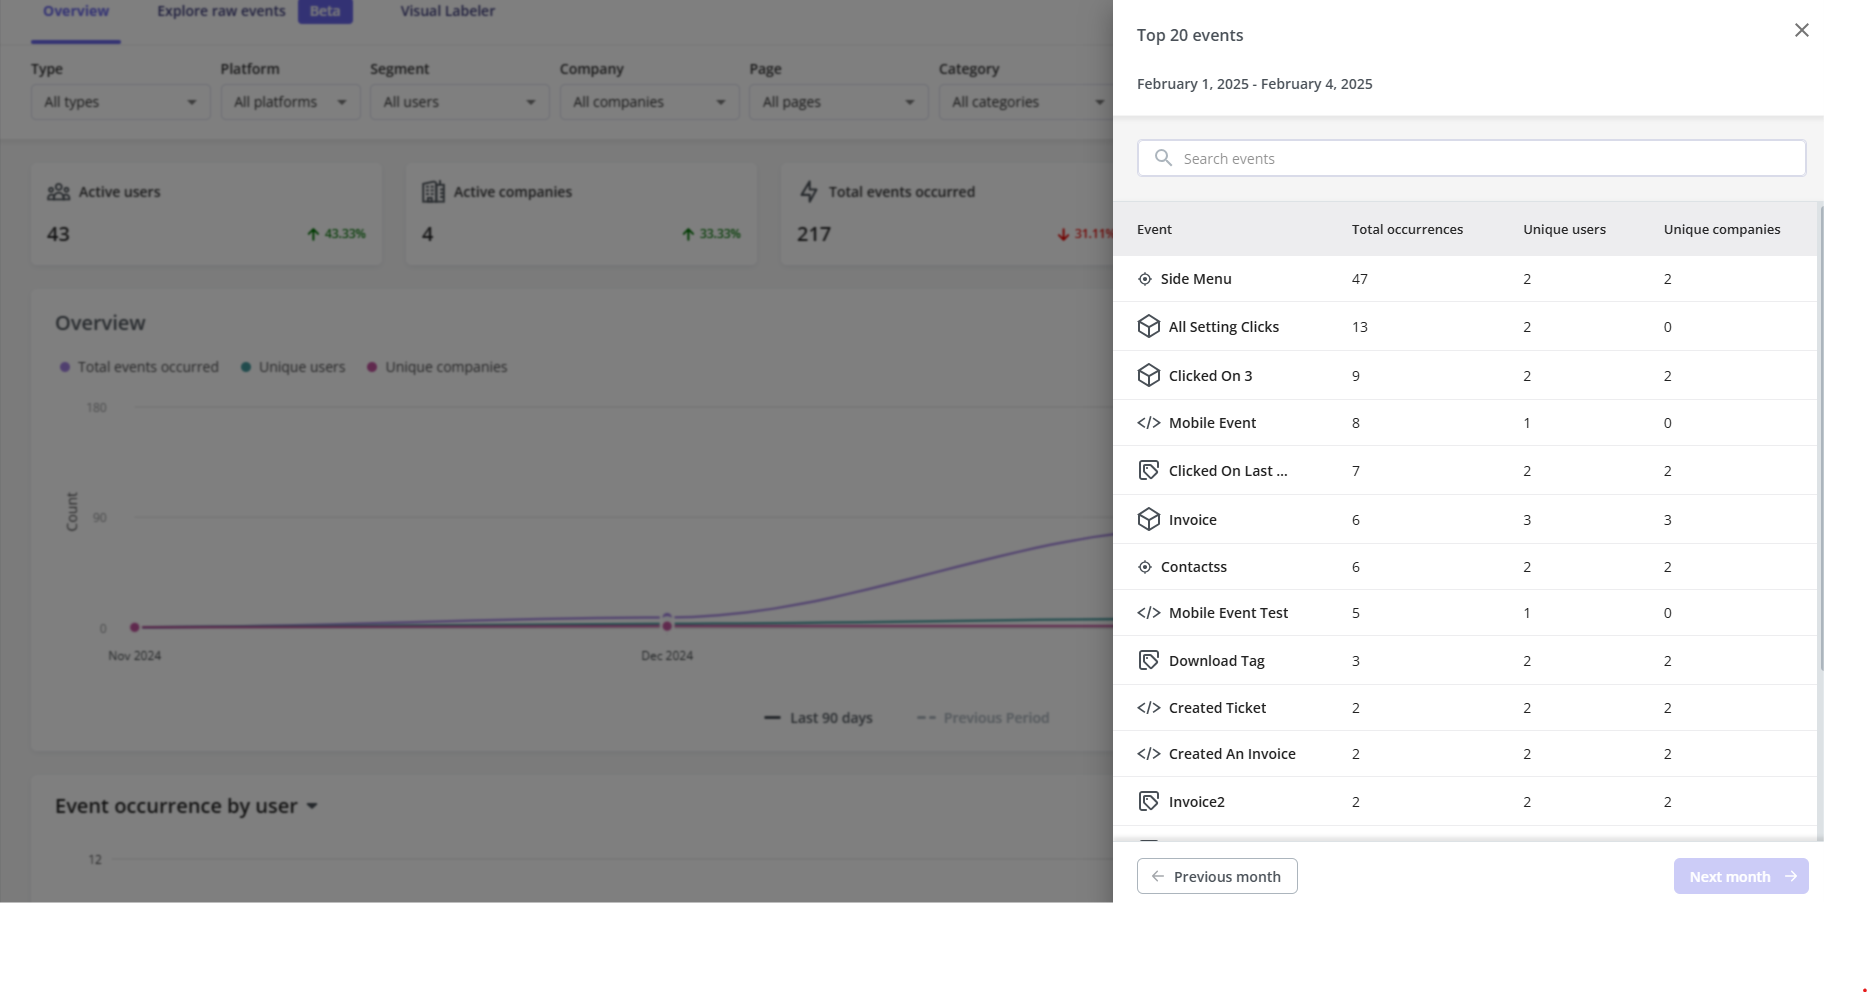
Under the Events Overview tab, all event-related details can be seen with a variety of filters to show event data accordingly, these filters would affect all of the data showing in the dashboards.
Active users/companies, total events occurred, and average occurrences per user can be seen at the top, the percentages next to each would be comparing the current numbers with the past period for the same chosen time period (e.g Last 90 days, would compare the data with the 90 days before that).
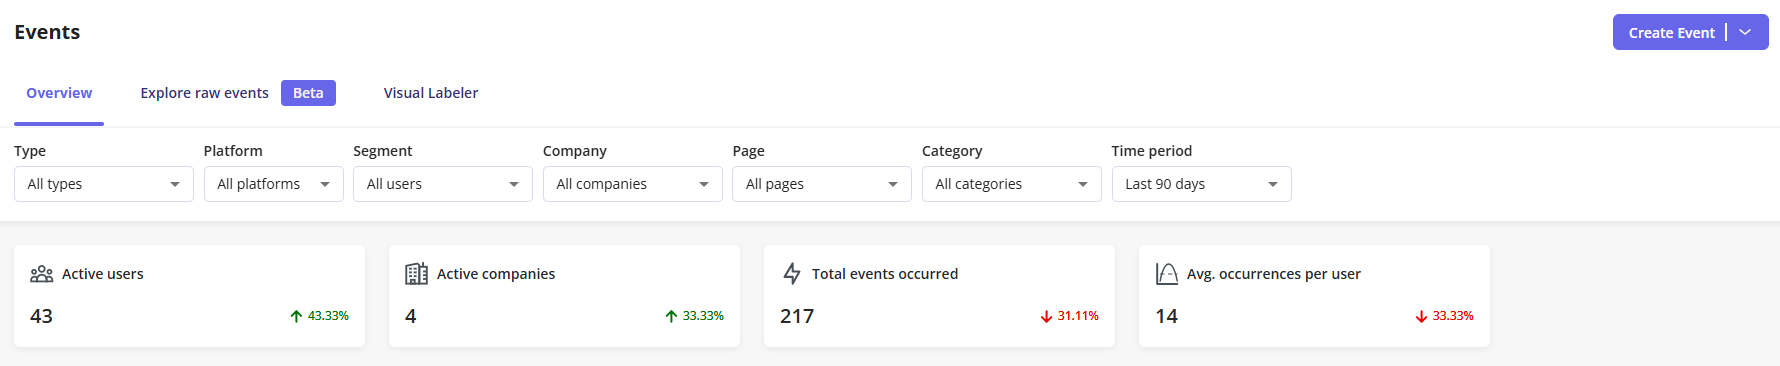
Custom Events are not considered in any total events count, since they would already be included in the related event the custom event was created from.
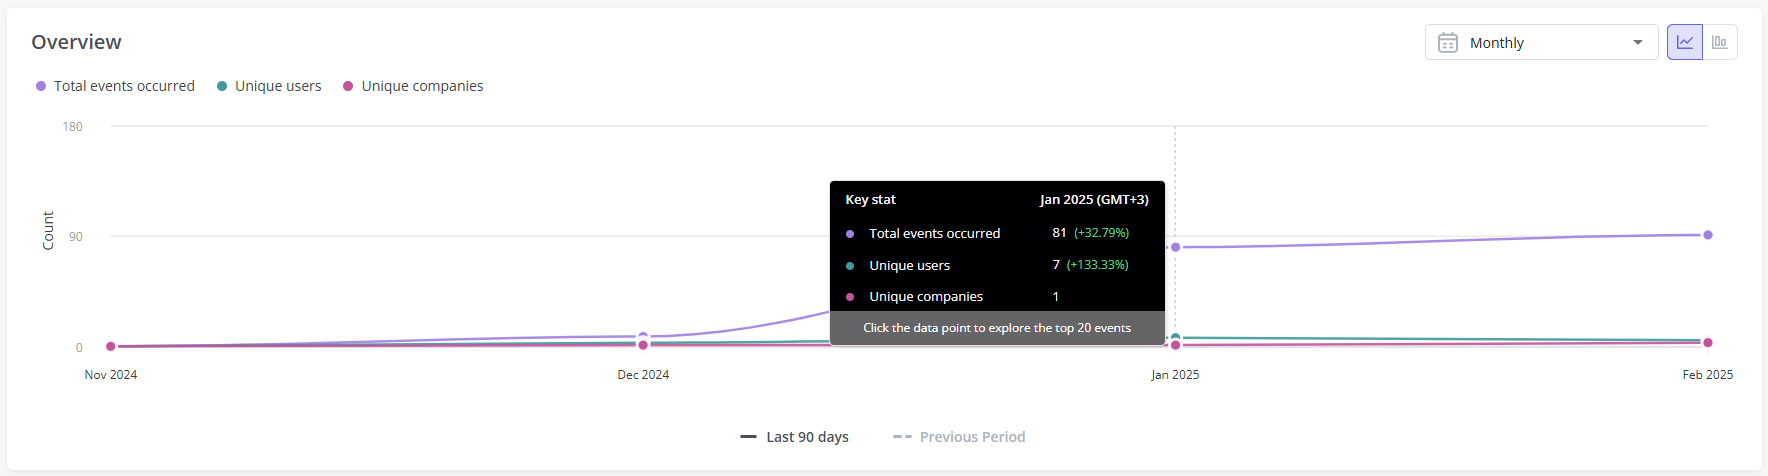
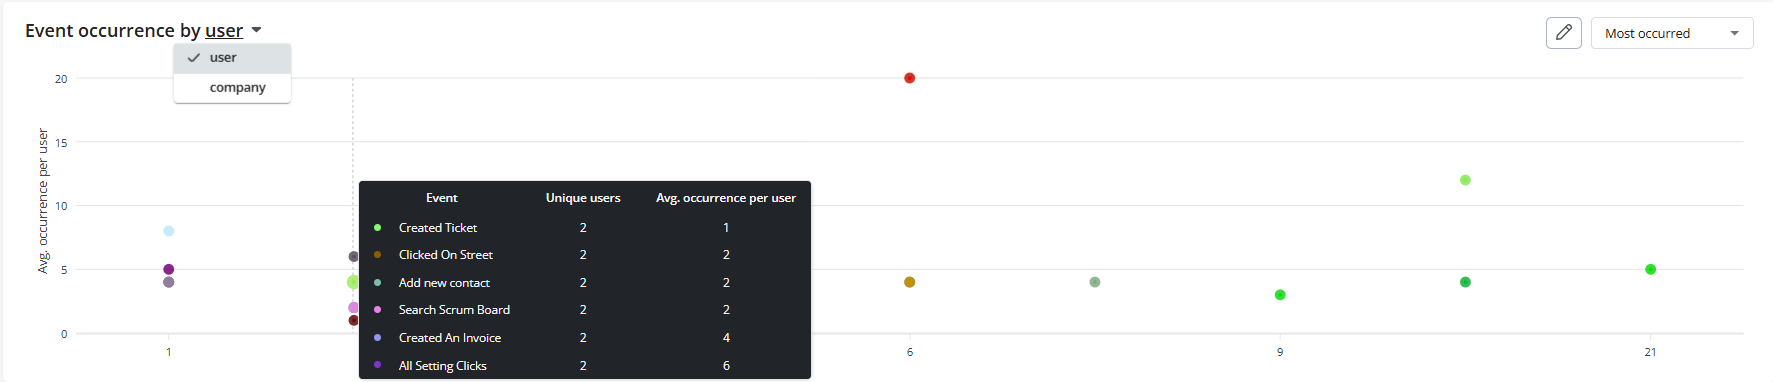
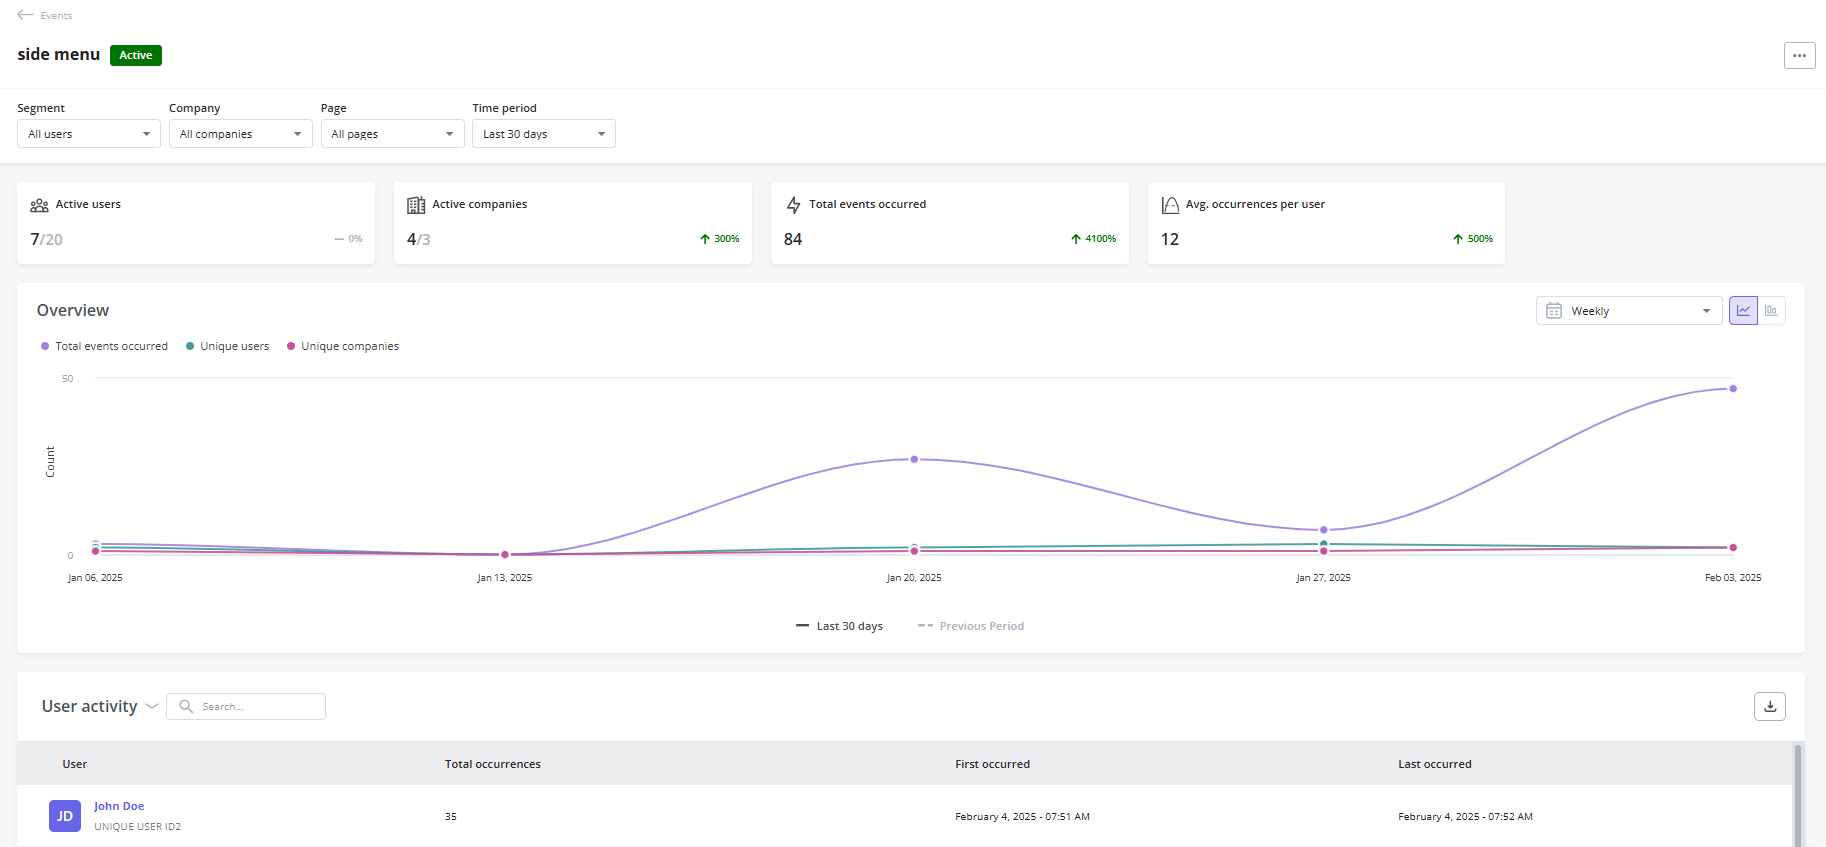
Tracked Events Metadata can be seen when clicking on the Overview chart. This can be customized under the arrange columns button and up to 2 properties or event attributes can be selected for each event.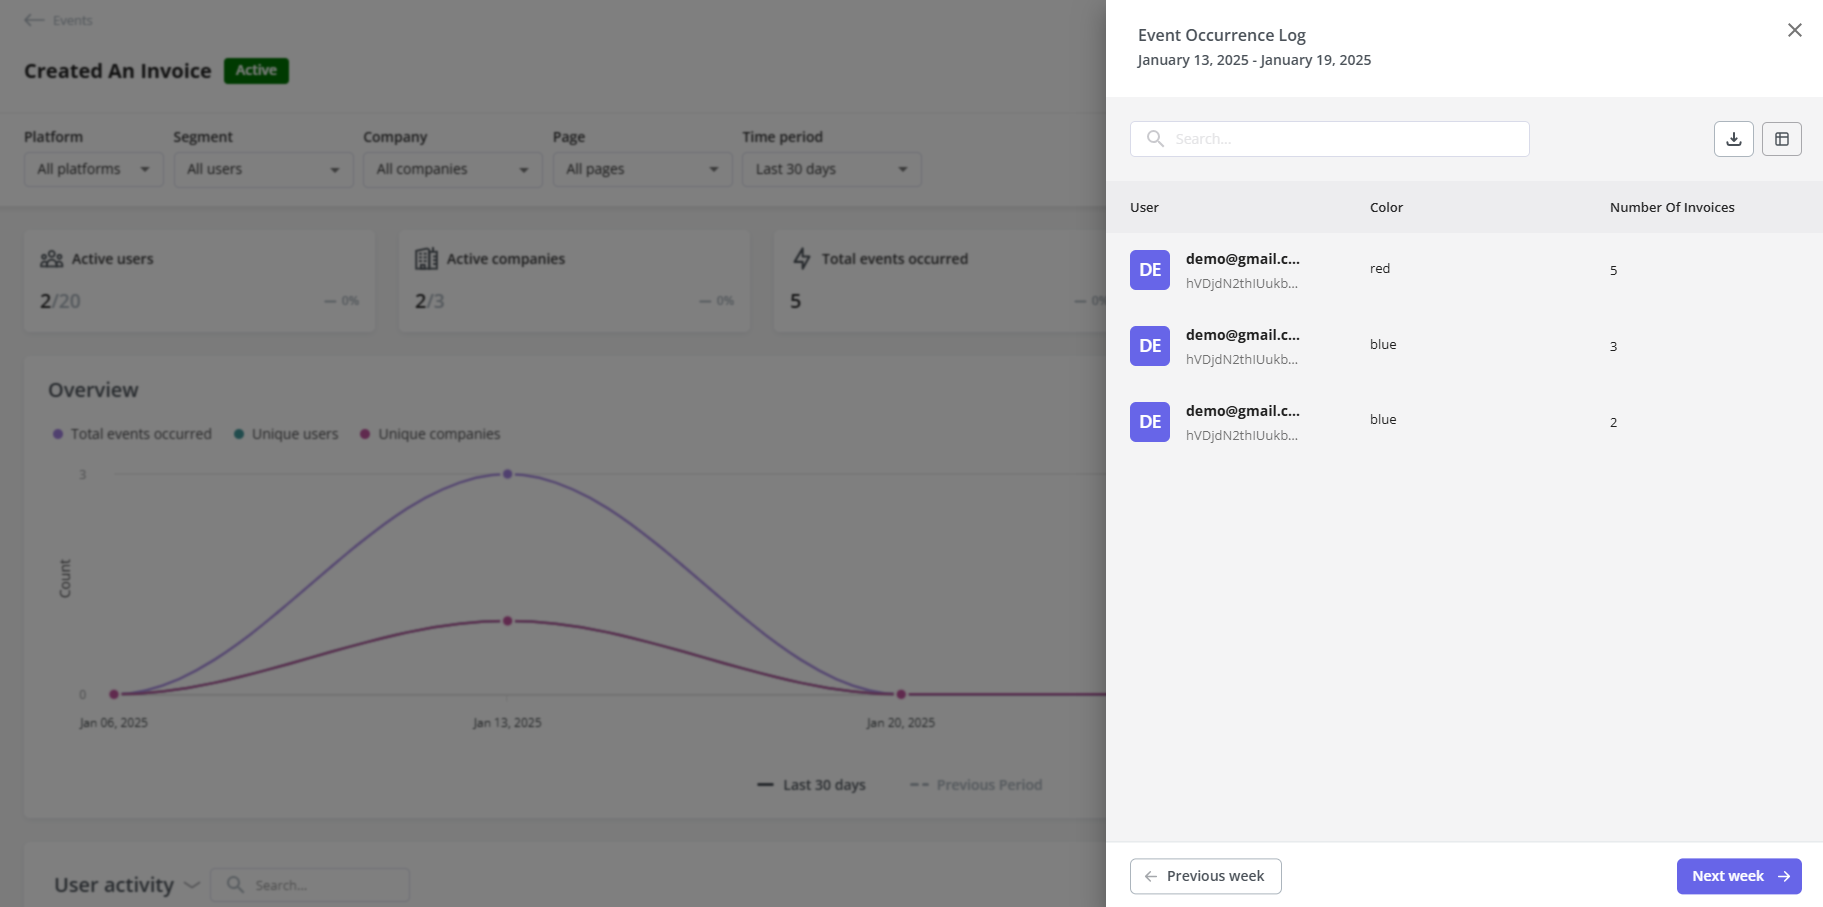
FAQs
Do archived events still collect data?
Do archived events still collect data?
Yes, even archived events would still collect data but it cannot be seen within the options or used anywhere else.
What would happen if I exceed my 25 event limit and still send tracked events?
What would happen if I exceed my 25 event limit and still send tracked events?
For events created in your account, you would see a banner preventing you from creating further events, as for tracked events sent through the SDK (via code), they would still be received but in an Archived state.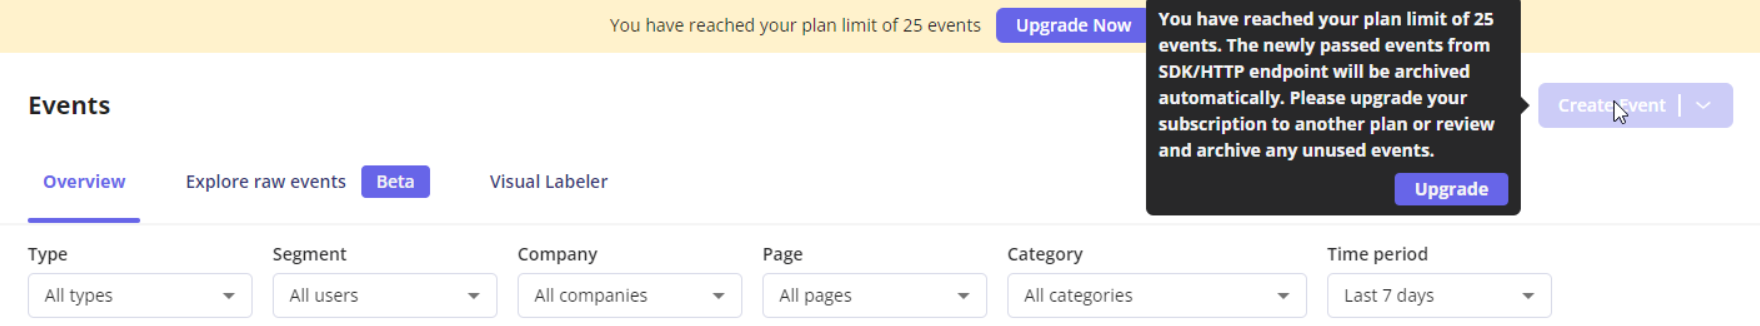
How can I delete an event?
How can I delete an event?
Events need to be archived first, then there should be a Delete option showing, this applies for labeled and custom events.