Overview tab
The overview tab consists of a list view of all users/companies that meet the criteria outlined in the global filters. Within the global filters, you can refine the list by:- Segment: show only users/companies that belong to a pre-defined Userpilot segment
- Company: show only users that belong to a specific company
- Last seen: specify the time period that the user / company must have been last seen within
- Last seen on: specify the platform that the user / company was last seen on (i.e. Web or Mobile)
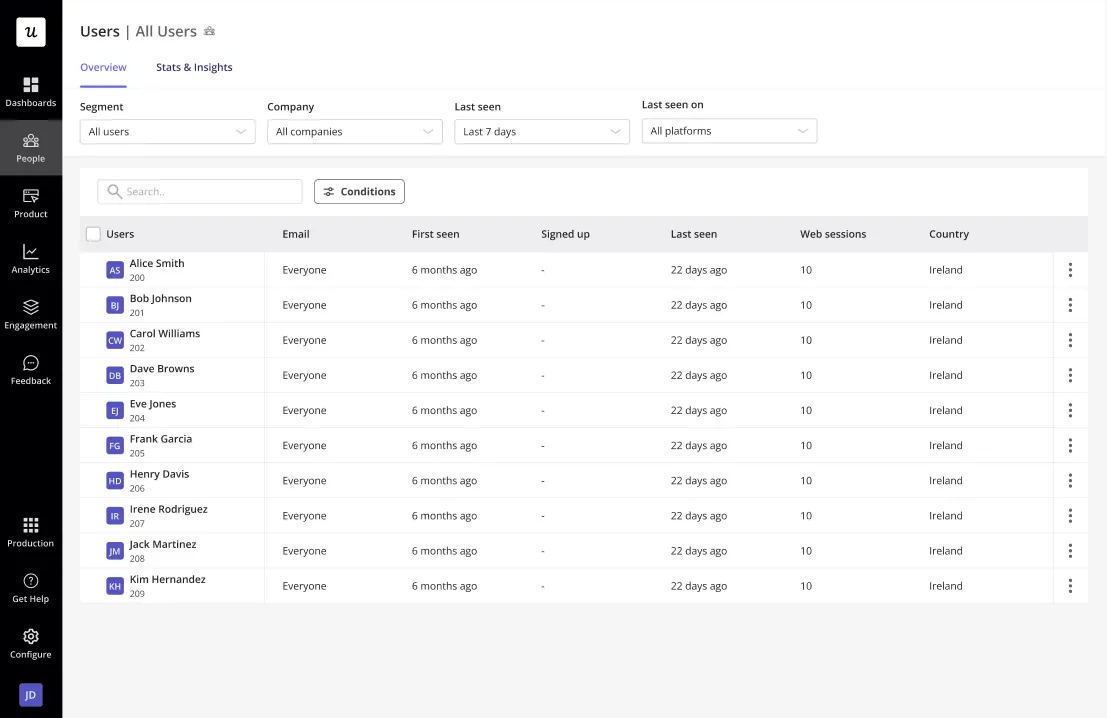
The Overview table includes users and companies who have been identified on your web application or through backend user identifications (e.g. syncing from integrations or identified through the HTTP API). To filter by only those who have been identified by Userpilot on your platform use condition: “User data → Web Sessions does not equal 0”.
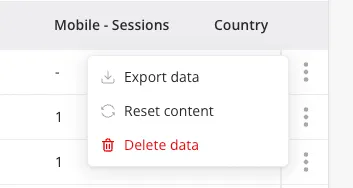
- Export data: Allows you to download a comprehensive report of the user’s information and activity in CSV format for further analysis.
- Reset content: Resets the user’s progress within the product, allowing them to experience content as a first-time user
- Delete data: Permanently removes all of the user/company’s data from the Userpilot account.
Stats & Insights Tab
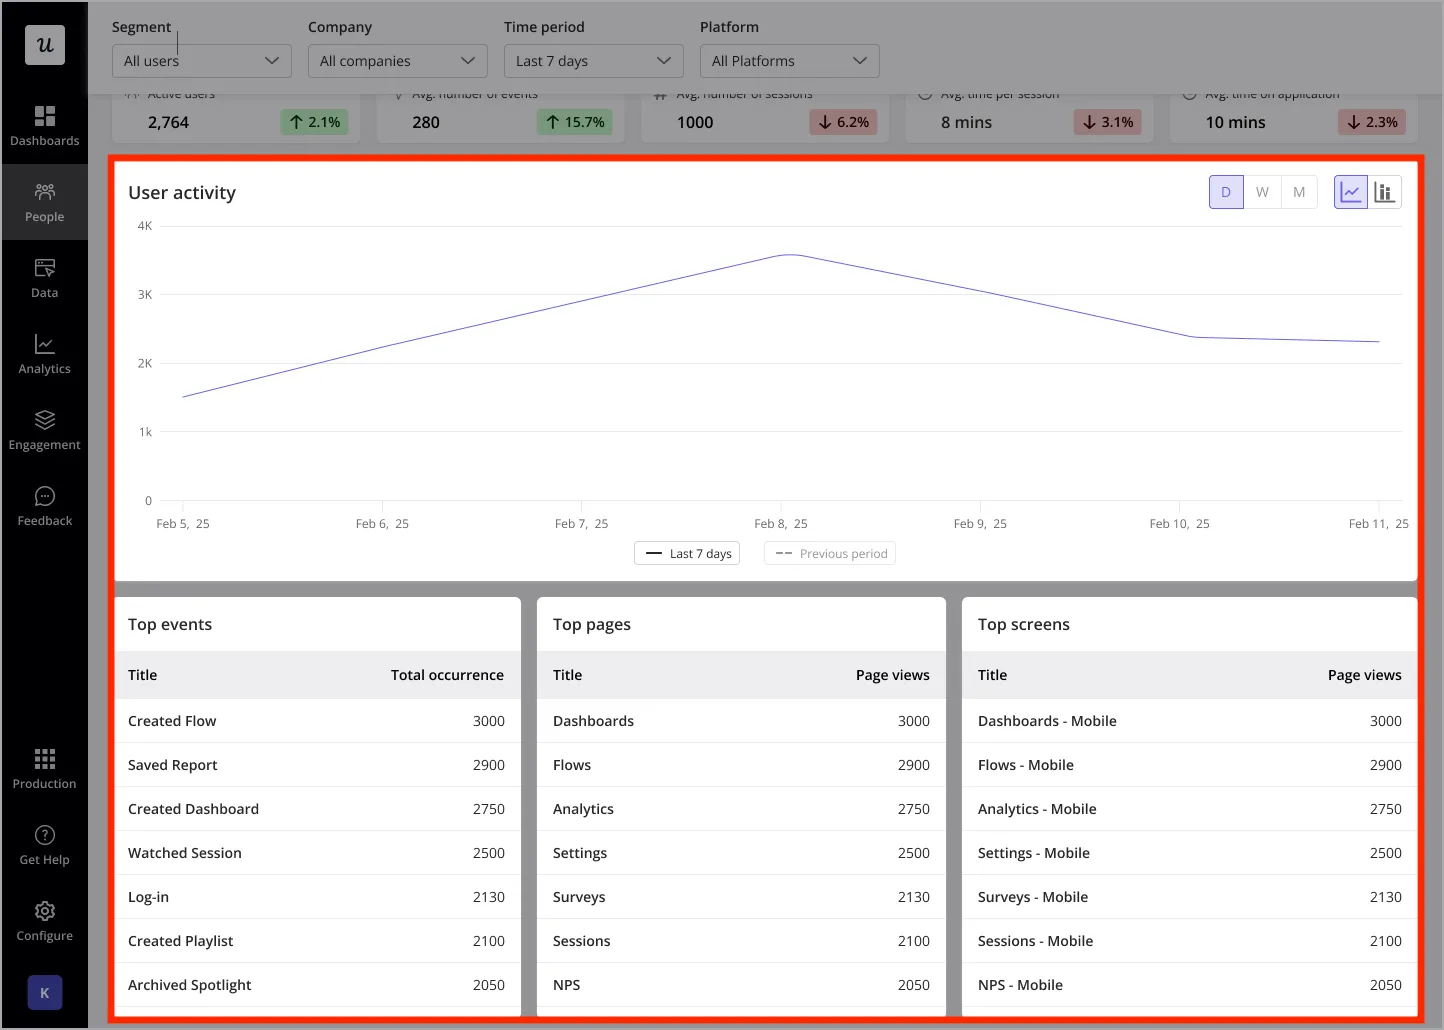
The stats & insights tab provides a summary of key user / company statistics based on the global filters applied. Each of the key stats cards also provides a trending view of the data compared to the previous period.- Active users / companies: The number of users / companies who generated activity in a real session on your web or mobile platform during the selected time period (this does not include users / companies who were only identified through the HTTP API without ever visiting your product)
This can differ from the total shown on the Overview tab. Stats & Insights only counts online activity (a real web or mobile session), while Overview counts both online and offline activity - including users / companies identified only through the HTTP API who never visited your product.
- Avg. number of events: A count of all tracked event, labeled event and feature tag occurrences divided by the number of active users / companies
- Avg. number of sessions: Total number of sessions initiated divided by the number of active users / companies
- Avg. time per session: The average length of time a user spent on your platform per session
- Avg. time on application: The average length of total time a user / company spent on your application over the specified time period
- NPS: The average NPS score for all companies (Company dashboard only)
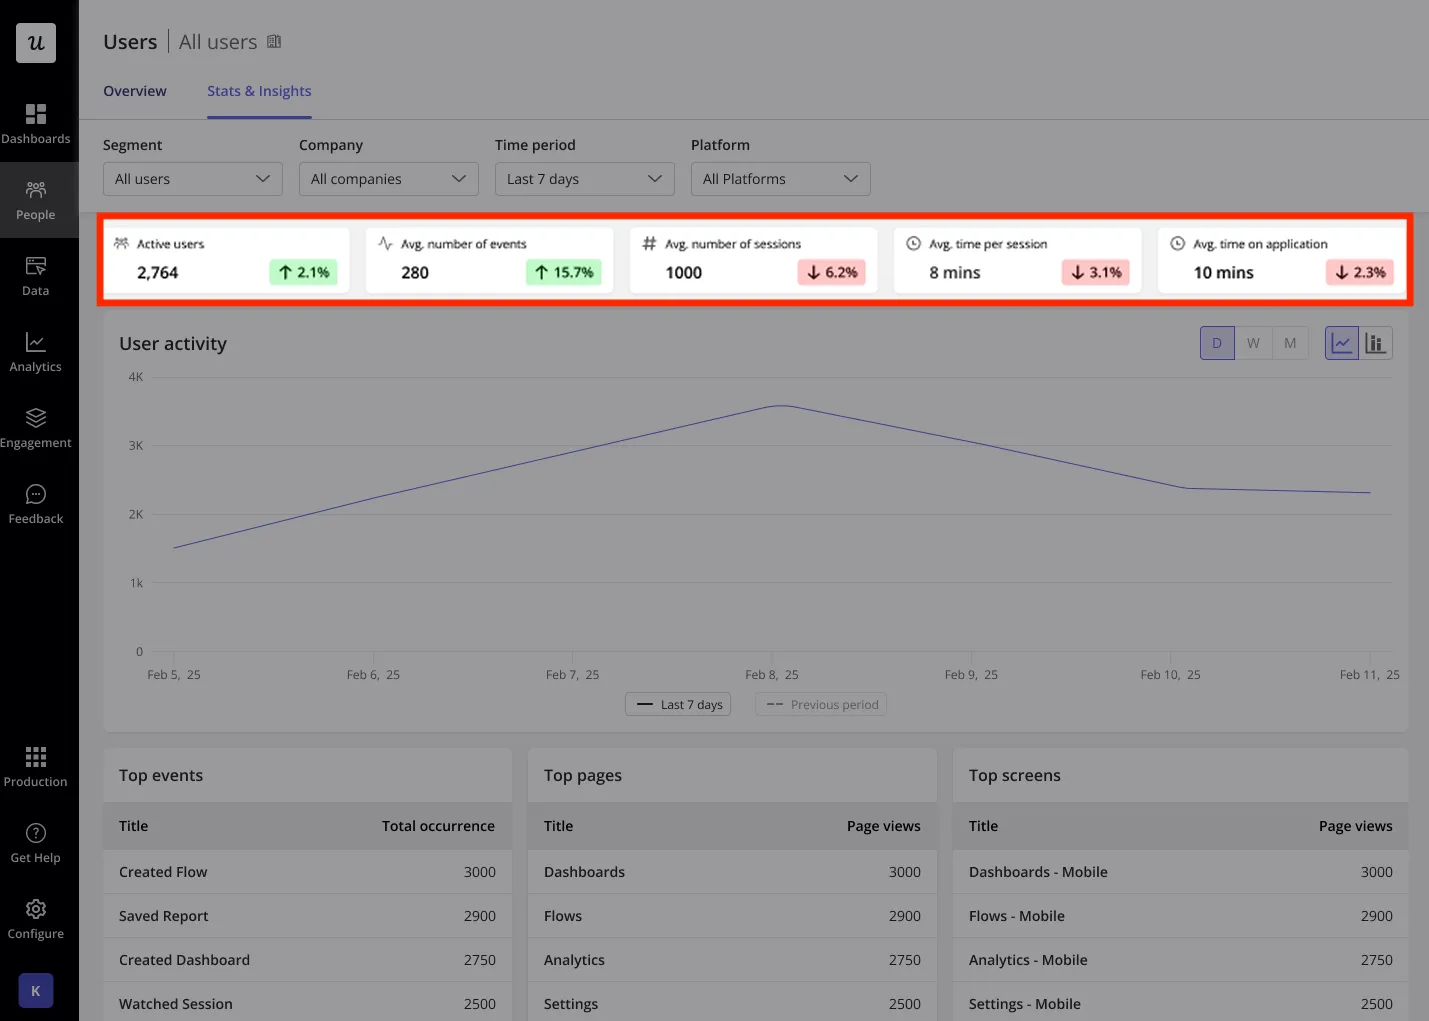
- User / Company activity: A chart view of the unique users / unique companies that visited your platform. This can be viewed on a daily, weekly or monthly basis.
- Top events: The events that occurred most frequently over the specified time period.
- Top pages: The most frequently visited web pages over the specified time period.
- Top screens: The most frequently visited mobile screens over the specified time period.
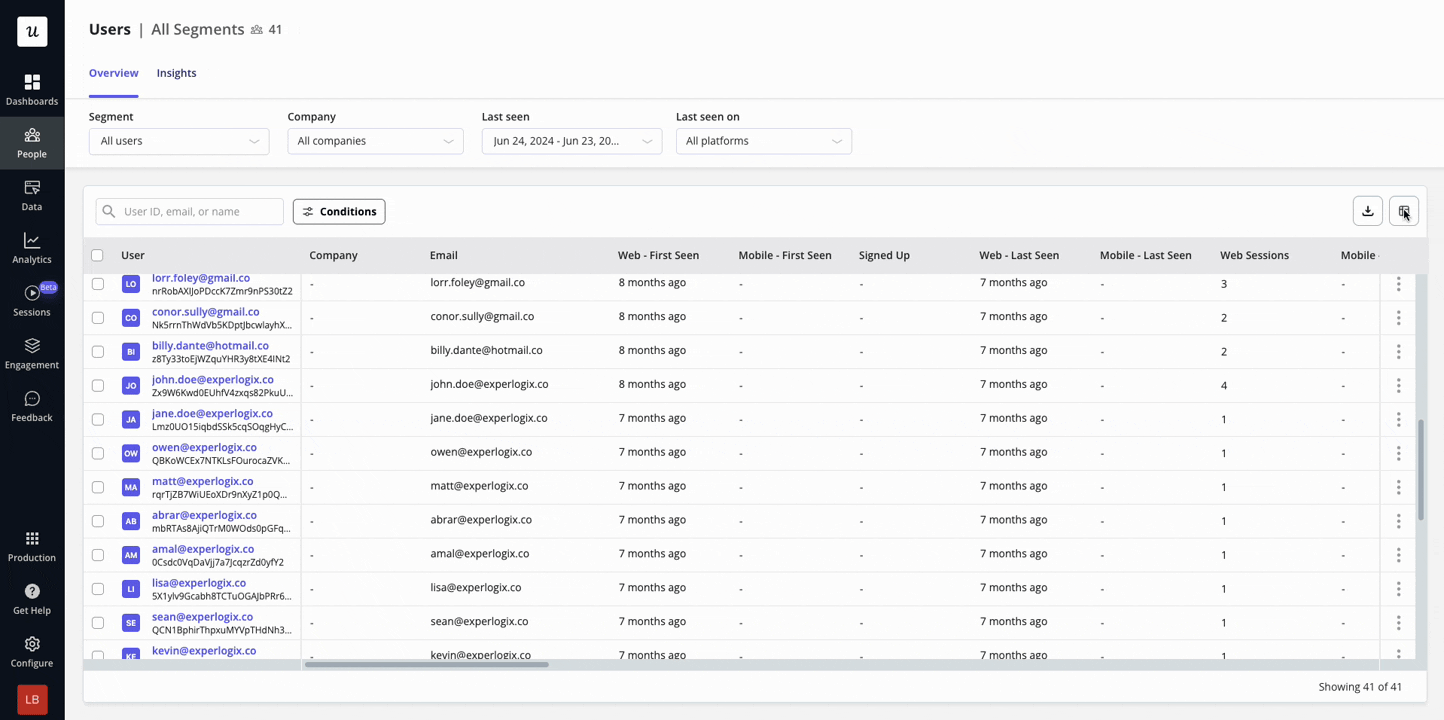
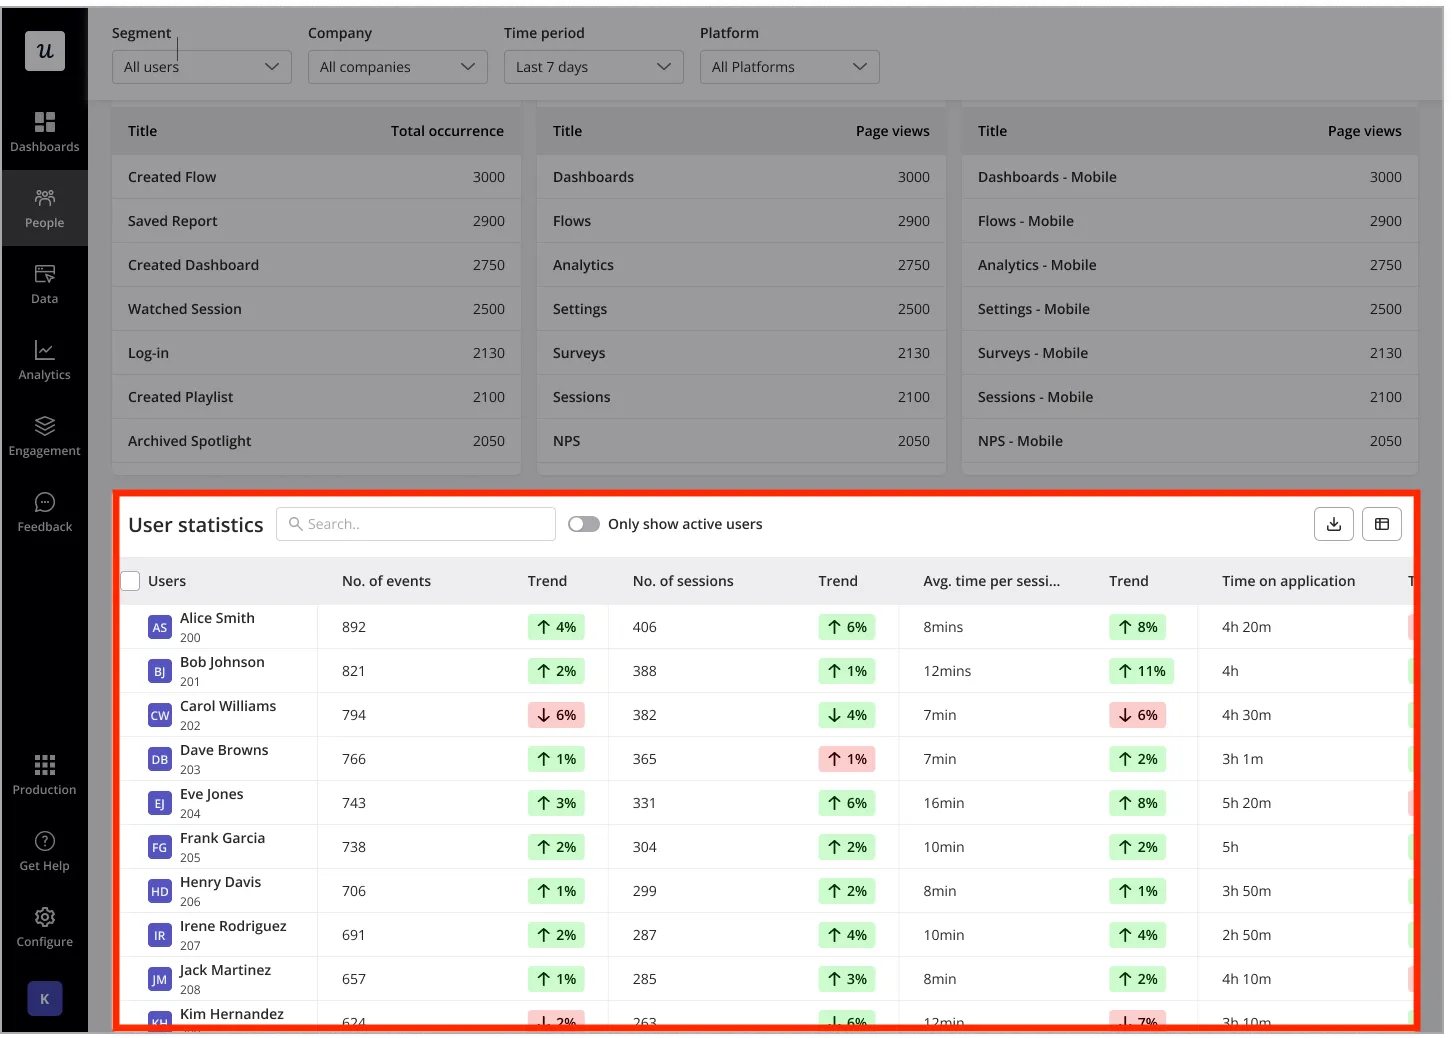
- No. of events: The total number of labelled, tracked or feature tagged events that the user / company has triggered
- No. of sessions: The total number of sessions that have been initiated by the user / company
- Avg. time per session: The average time spent per session for the specific user / company
- Days active: The number of days the user / company were identified
- Time on application: The total time spent on application by the user / company over the specified time period
- Active users: The number of users identified within that company (Company dashboard only)
- NPS: The company’s NPS score for the specified time period (Company dashboard only)
FAQs
How do I reset a user's progress?
How do I reset a user's progress?
There are two way to achieve that:
- Click the three dots next to the user’s name and select “Reset Content.”
- Call
userpilot.reset();in the console
Can a user belong to more than one company?
Can a user belong to more than one company?
No, at the moment, one user ID can belong to only one company ID. If a user is identified with a different company, it will override the previous value. However, a workaround is to pass an additional company property, for example:
company_names: "acme labs, doe company"Is it possible to track users who have not interacted with my product recently?
Is it possible to track users who have not interacted with my product recently?
Yes, you can use the “Last Seen” filter to identify users who have been inactive for a specific period and target them for re-engagement.
Can I view historical data for deleted users?
Can I view historical data for deleted users?
No, once a user is deleted, their data is permanently removed from the system and cannot be retrieved. However, if the user is identified from your end again, they will reappear in the dashboard, but their old data and content analytics related to that user will not show.
Is resetting the users going to delete the users permanently?
Is resetting the users going to delete the users permanently?
No, it only resets the content eligibility for the user during their existing session. Once they go into a new session, they will get back their state before the reset.
What is the difference between the 'Last Seen' filter in the Overview tab and the 'Time Period' filter in the Insights tab?
What is the difference between the 'Last Seen' filter in the Overview tab and the 'Time Period' filter in the Insights tab?
The “Last Seen” filter in the Overview tab focuses on when a user was last active, meaning it shows users based on the most recent time they interacted with your product. This helps you track individual user engagement and identify inactive users.On the other hand, the time period selection in the Insights tab provides aggregated data for all users within a specific timeframe, giving you an overall view of user activity trends, such as daily, weekly, or monthly performance. This helps you analyze patterns and measure engagement over time.
What is the difference between using 'AND' and 'OR' conditions in filters?
What is the difference between using 'AND' and 'OR' conditions in filters?
Using “AND” narrows your search by requiring all conditions to be met simultaneously, resulting in a more specific user list. Using “OR” broadens your search by including users who meet any of the specified conditions, leading to a wider dataset.