Overview
Net Promoter Score (NPS) is a metric used to measure customer loyalty by assessing how likely users are to recommend your product. NPS responses help businesses segment customers into three categories:- Promoters (9-10): Loyal customers who actively promote your product.
- Passives (7-8): Satisfied but not enthusiastic customers.
- Detractors (0-6): Dissatisfied customers who may churn and spread negative feedback.
The NPS score is calculated using the formula: Score = % of Promoters - % of Detractors
Use Cases
- Identify promoters and detractors to assess overall satisfaction.
- Address detractors’ concerns before they leave.
- Compare NPS over time to evaluate updates.
- Tailor marketing efforts and customer support based on user feedback.
NPS responses
Once you create an NPS survey, responses and data update on the NPS page. You can filter responses by Segment, Company, Time Period, or Platform (mobile app, web app, or all platforms) to analyze trends effectively.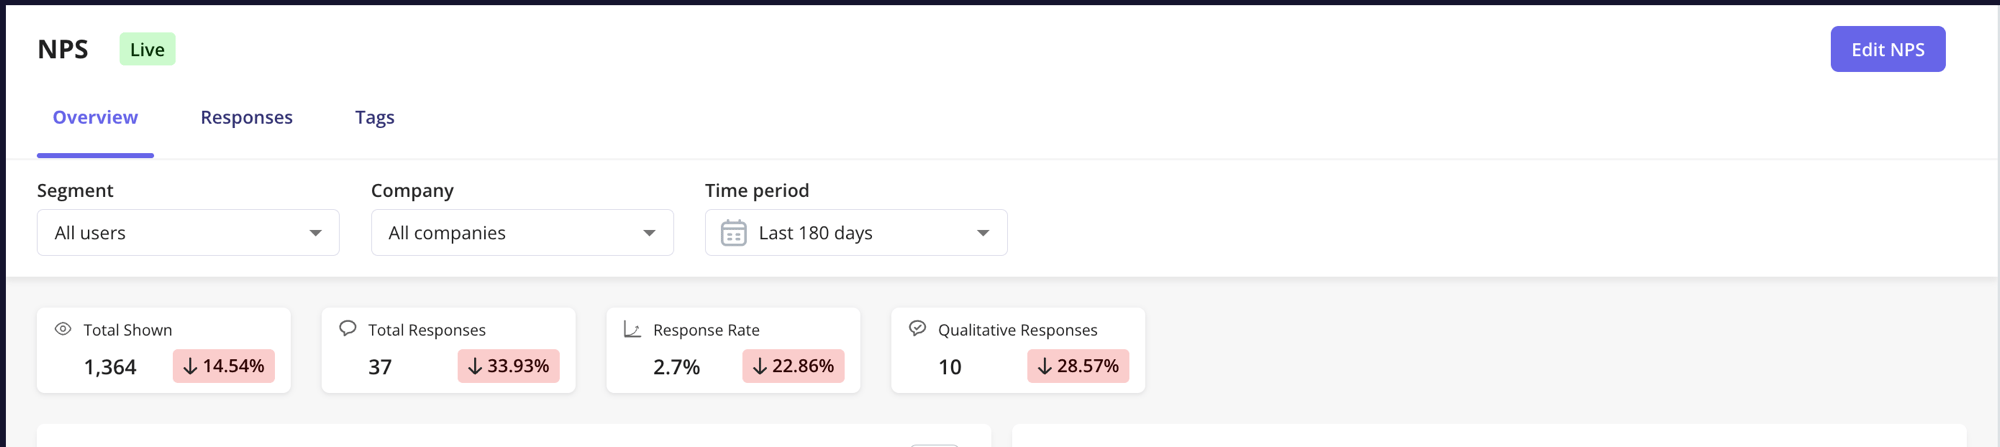
Key Metrics
- Total Shown: Number of times the survey was displayed.
- Total Responses: Number of users who submitted a response.
- Response Rate: Percentage of users who responded (Total Responses / Total Shown * 100).
- Qualitative Responses: Number of users who provided written feedback along with their score.
NPS history chart
The NPS History Chart tracks score trends over time. Hover over data points for detailed insights. You can also compare different time periods to evaluate how product updates impact user satisfaction.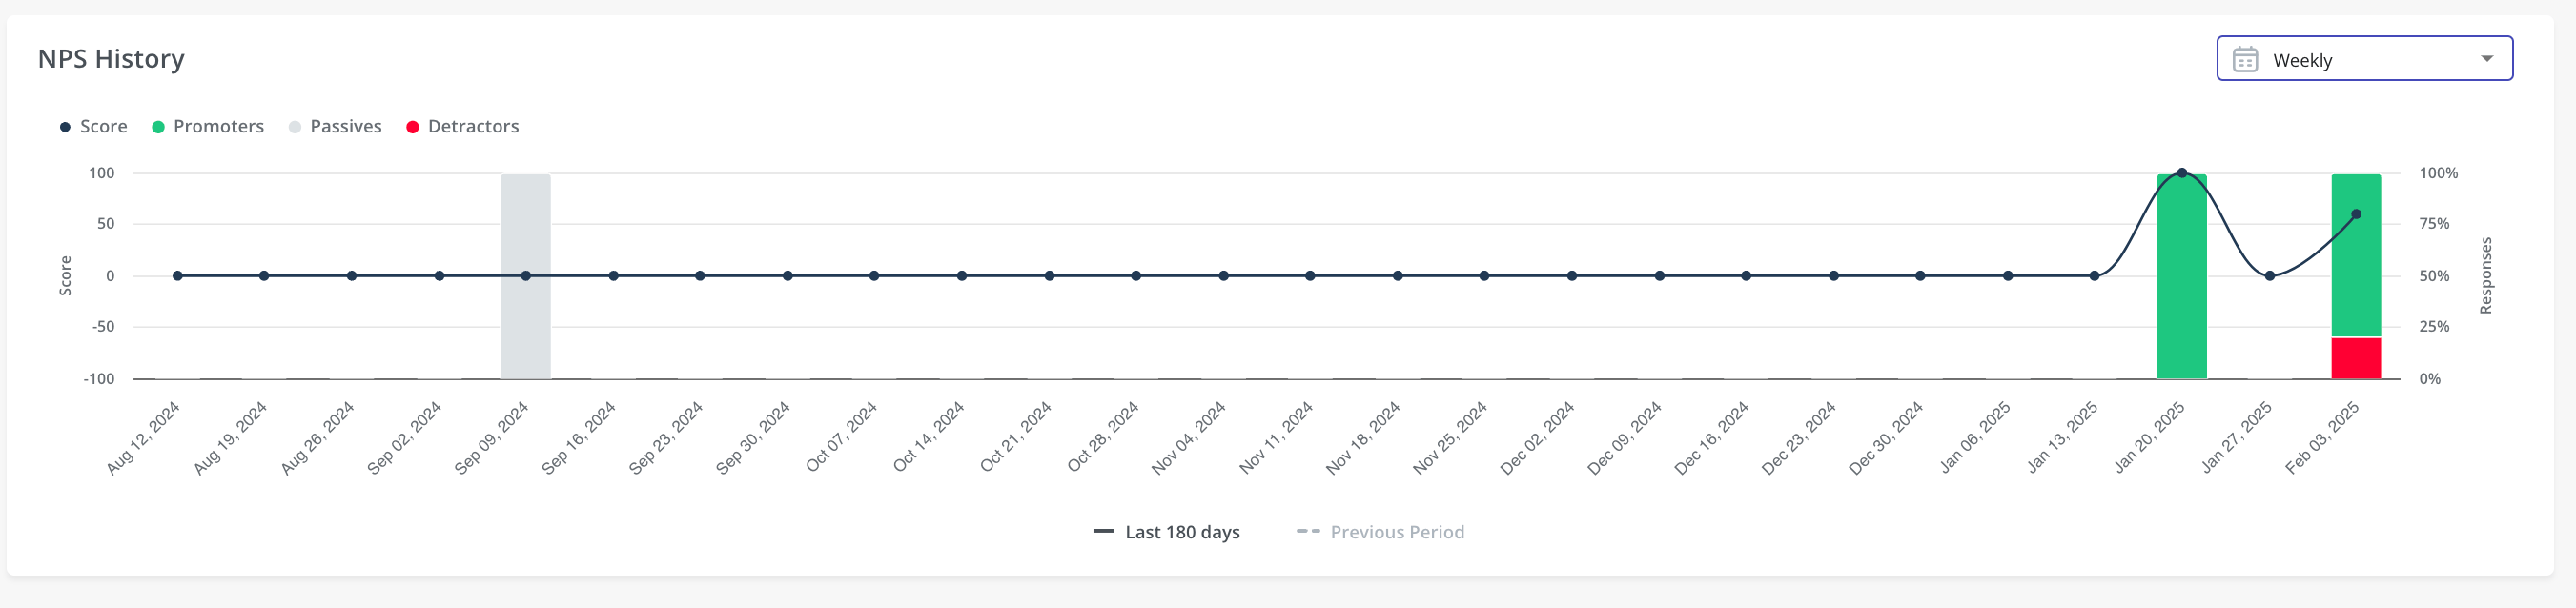
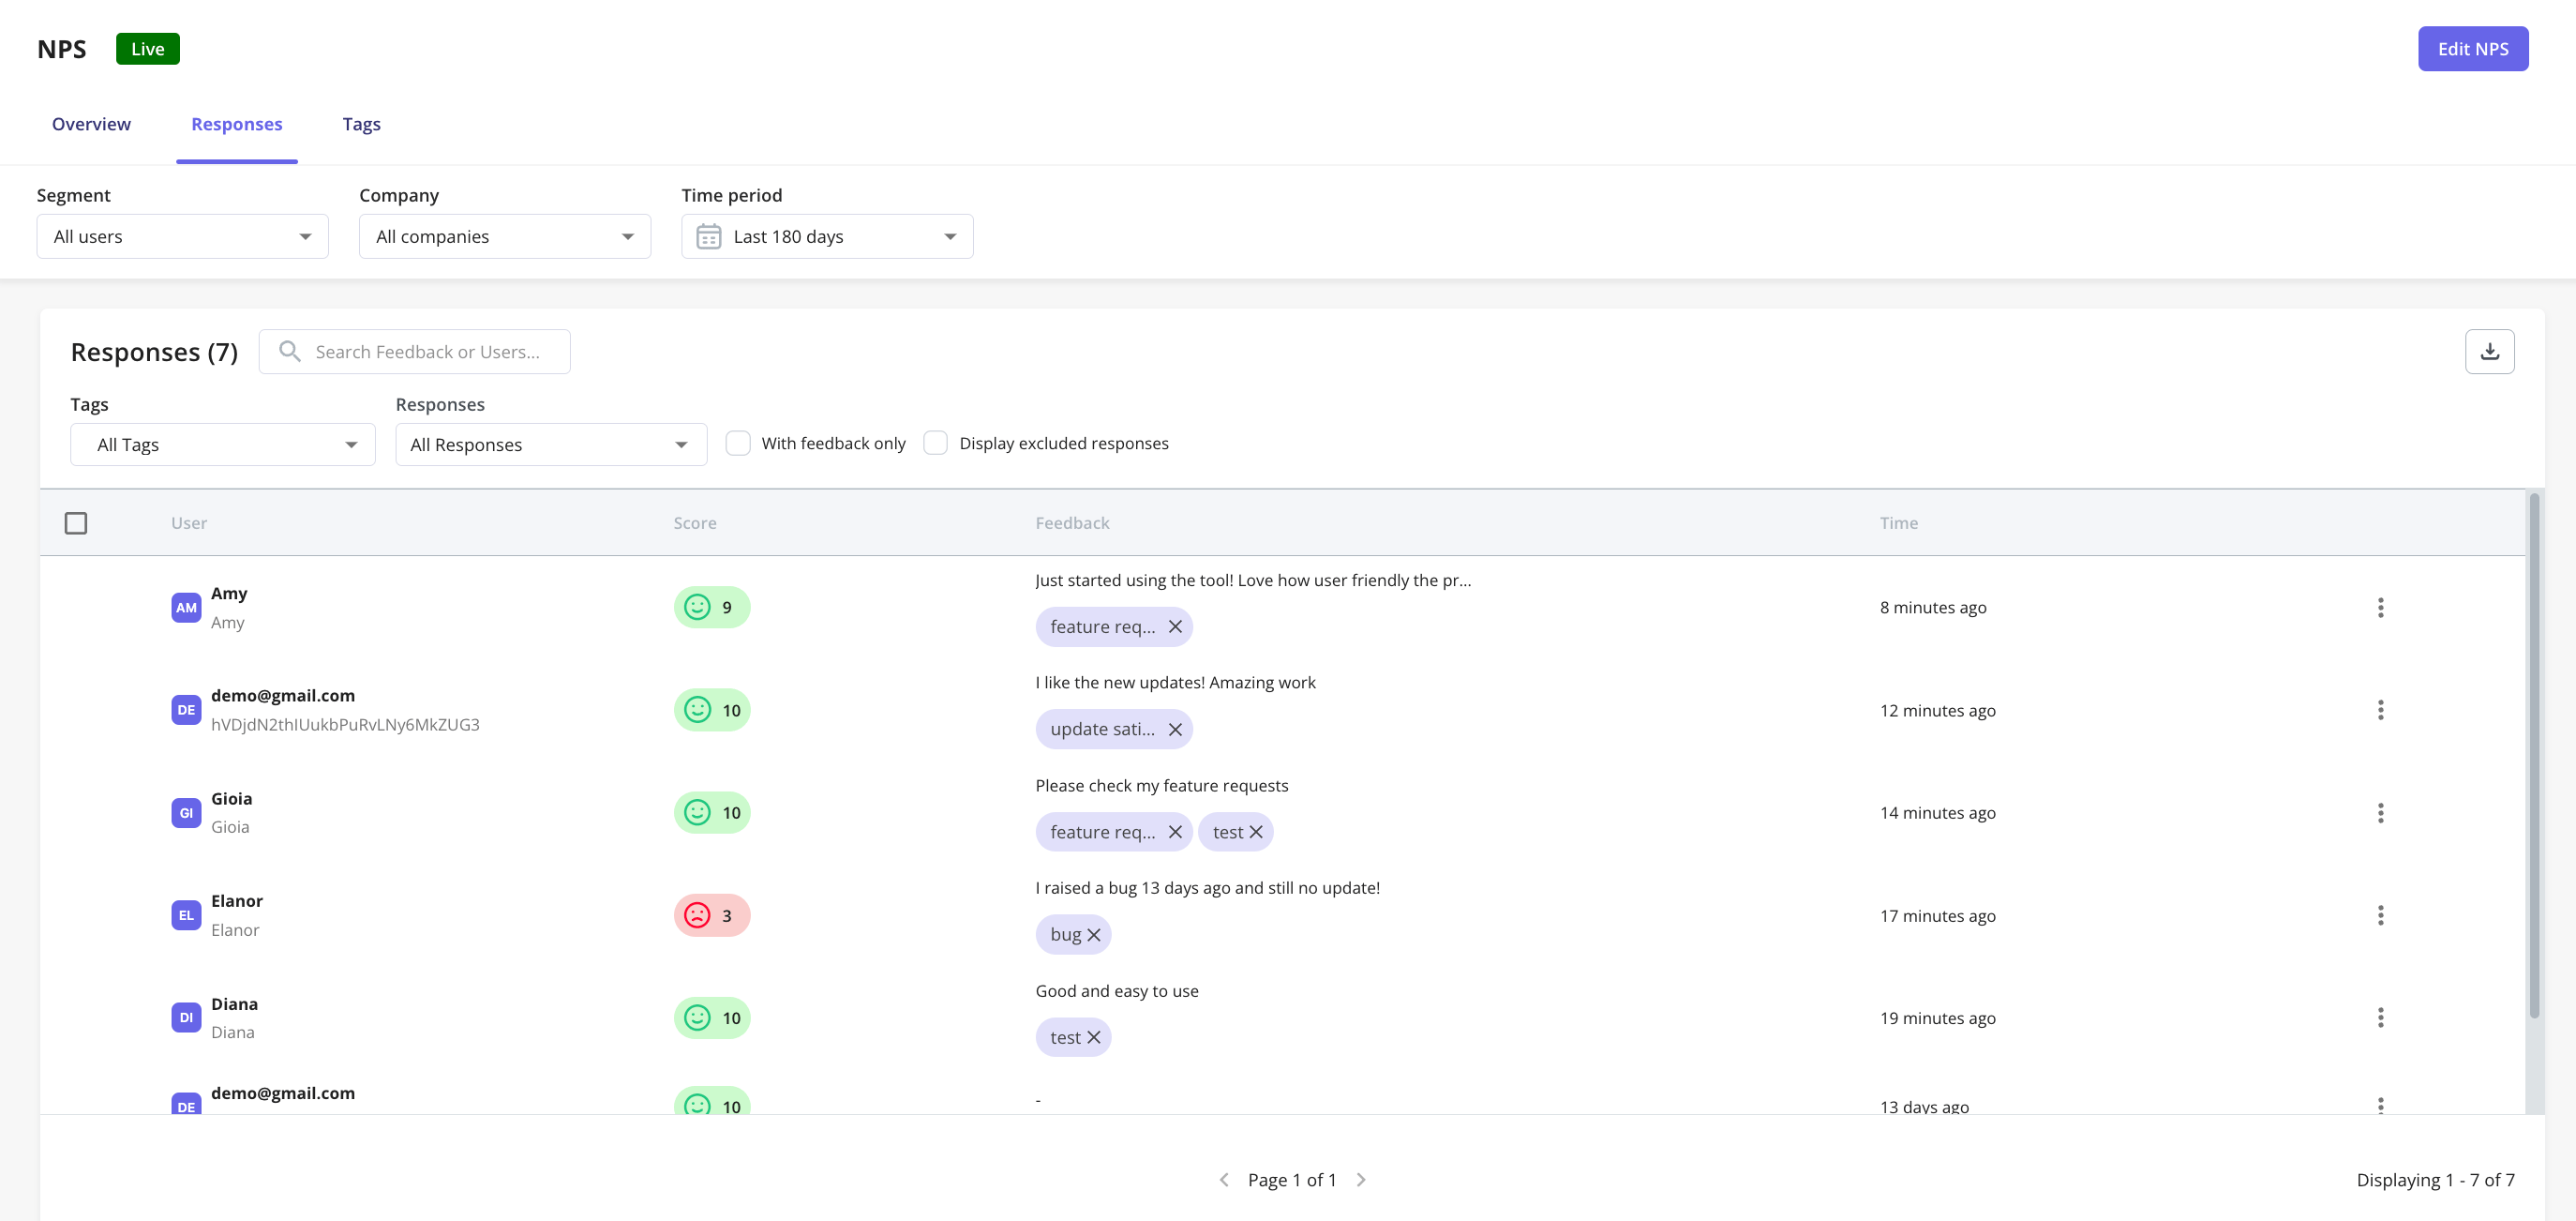
Responses breakdown
Filtering Options
- Tags: Categorize responses based on custom labels.
- Response Type: Filter by Promoters, Passives, or Detractors.
- With Feedback Only: Show only responses that include written feedback.
- Display Excluded Responses: View responses removed from NPS calculations.
NoteNPS is not designed to be triggered multiple times per day, except for testing, because repeated submissions from the same user can distort the overall NPS score. To align with industry-standard NPS practices, if a user submits multiple responses on the same day, only the most recent submission is counted.However, all NPS responses are still visible in both the table and the exported file based on the selected time-period filter.If your use case requires collecting multiple responses from the same user in a single day, we recommend using a standard survey instead.
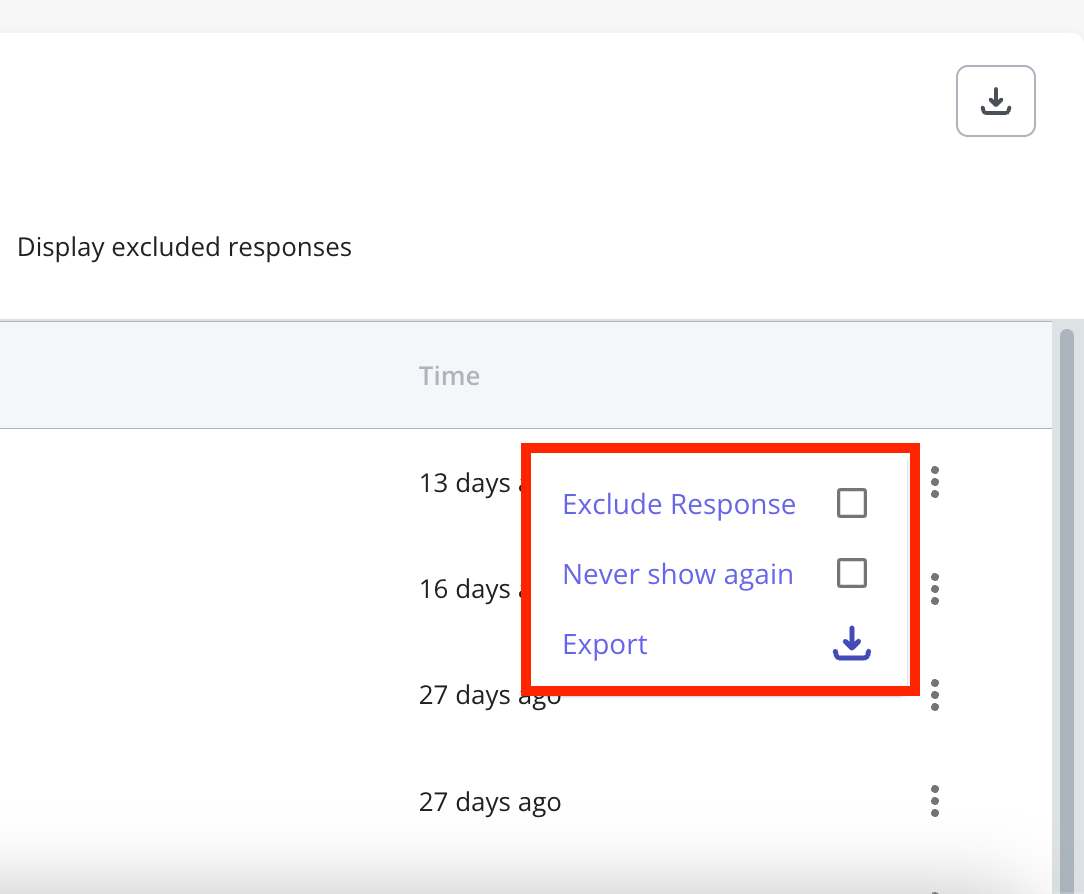
Response actions menu
Excluding responses Excluded responses are removed from NPS analytics, which is useful for filtering out test responses.- Click the three-dot menu on the response.
- Select Exclude Response.
- Click Export Data to download all responses.
- To export a single response, click the three-dot menu next to it and select Export.
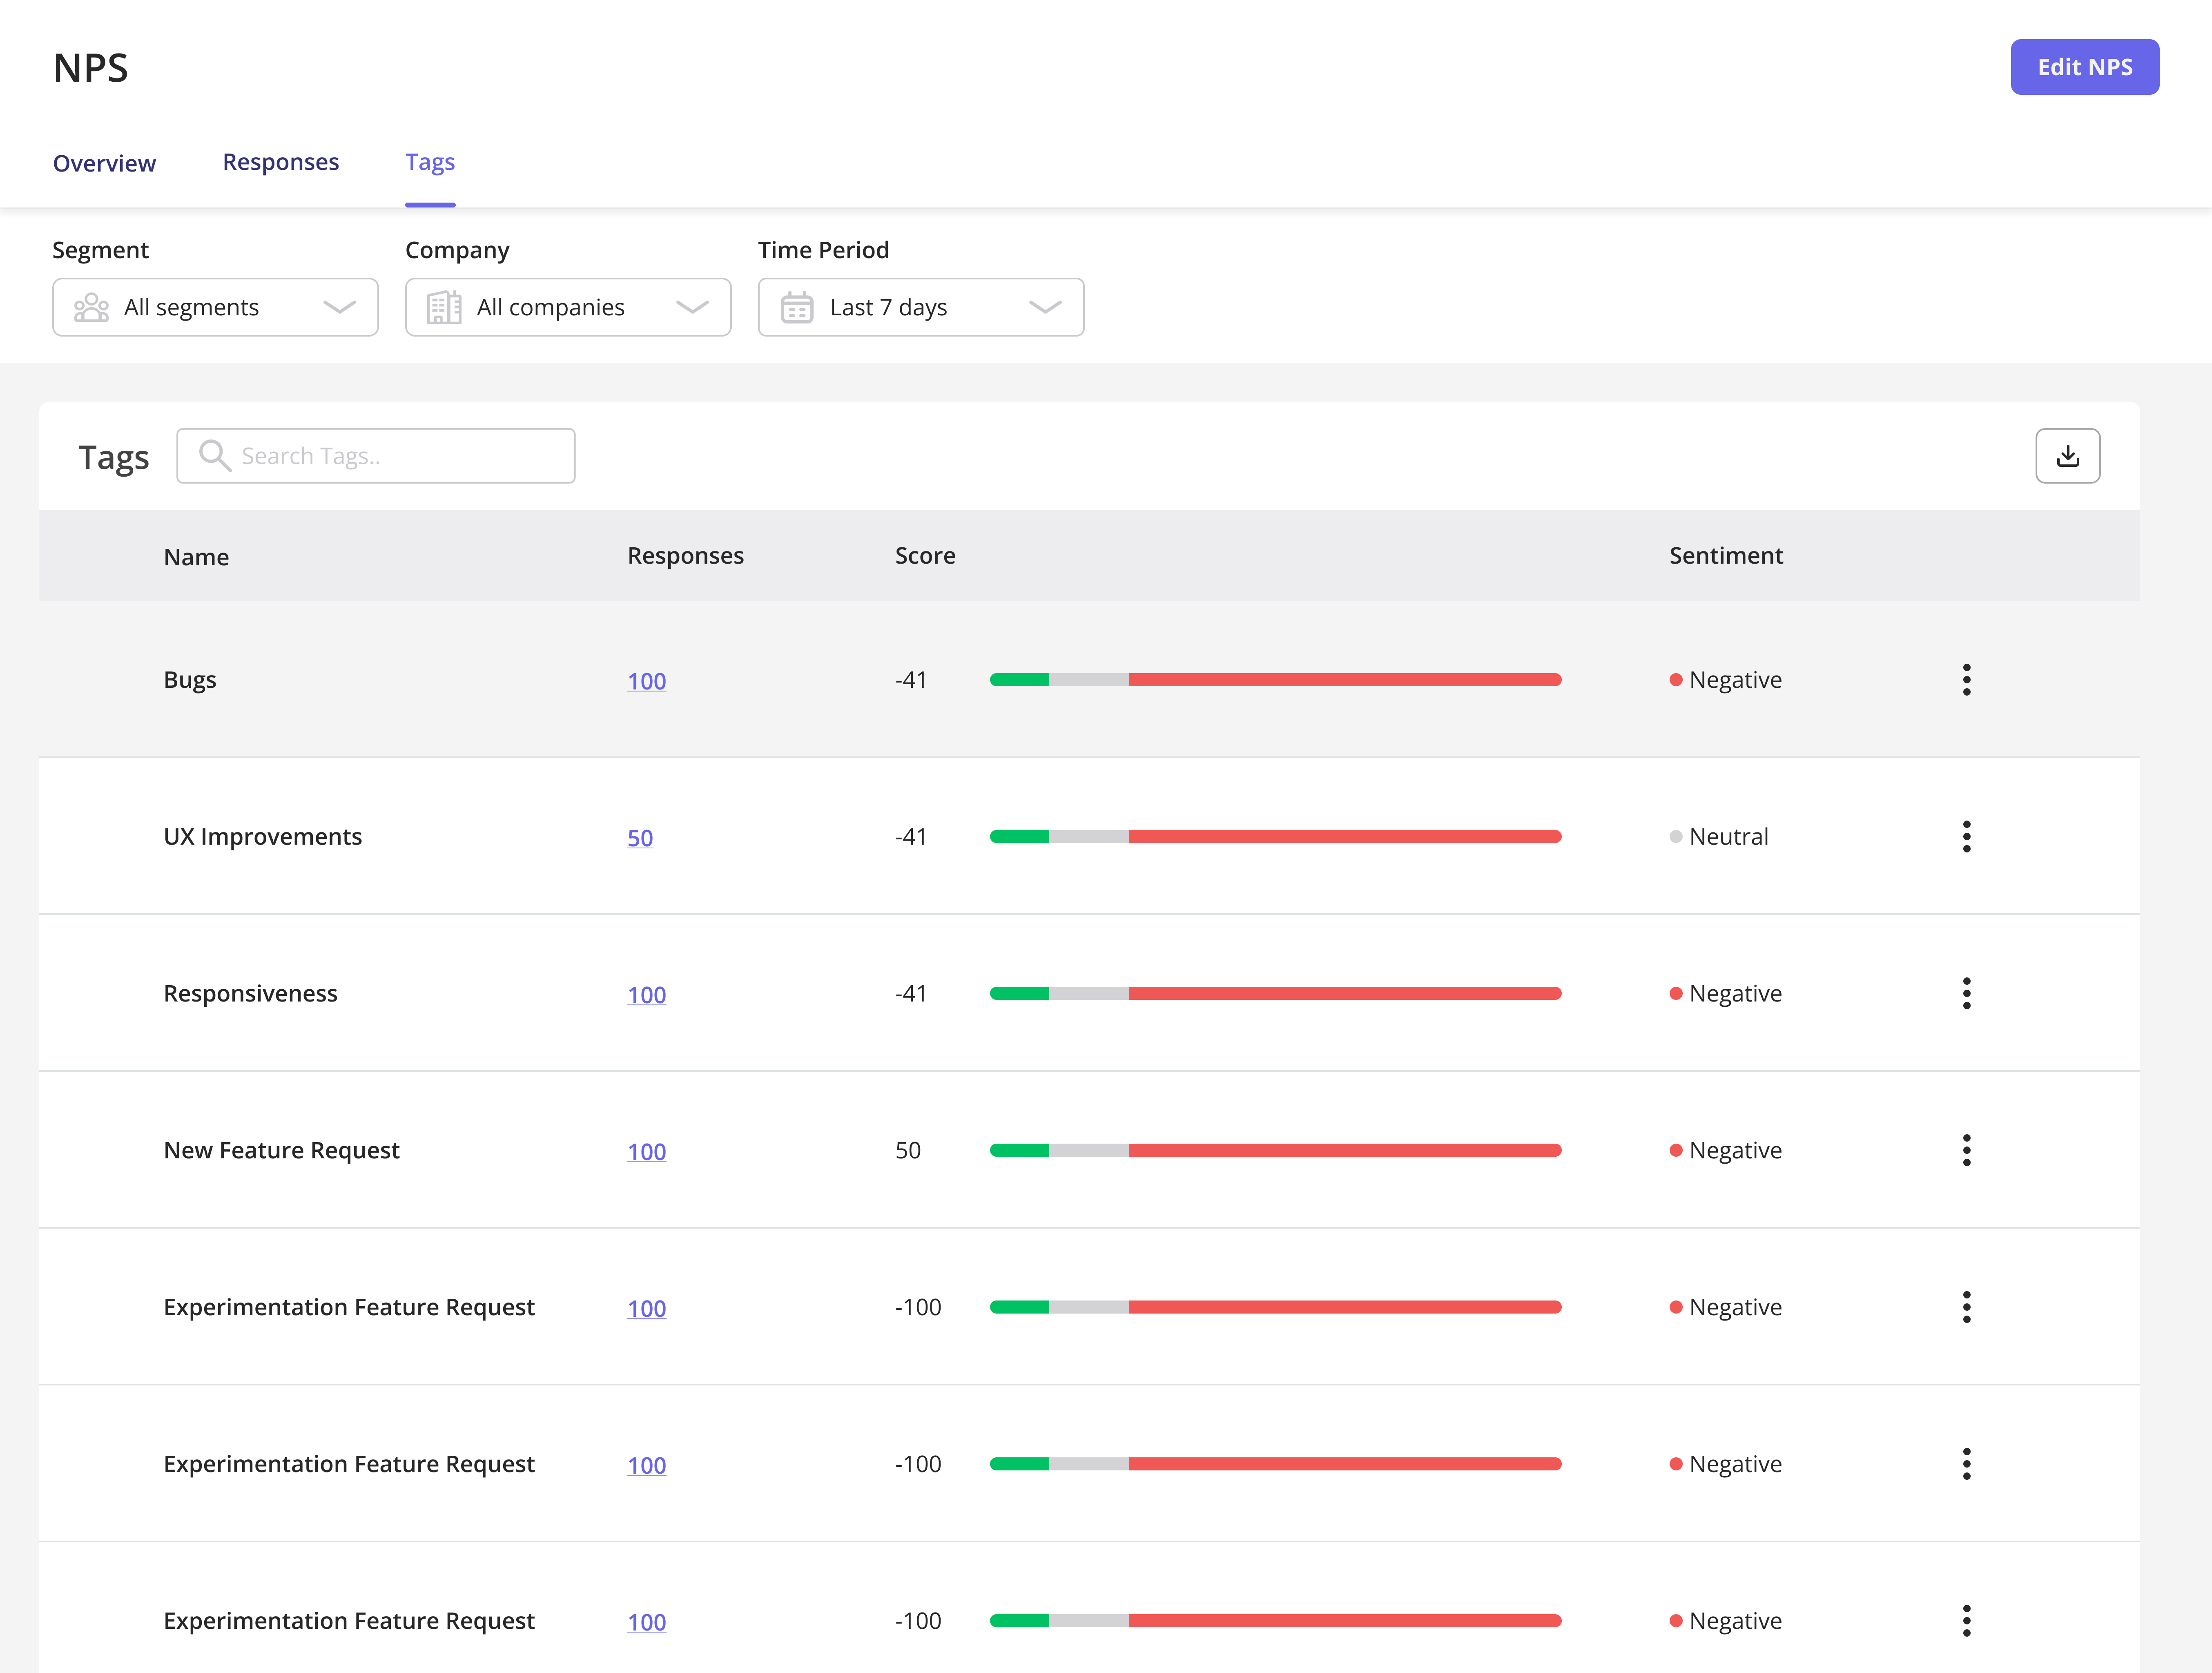
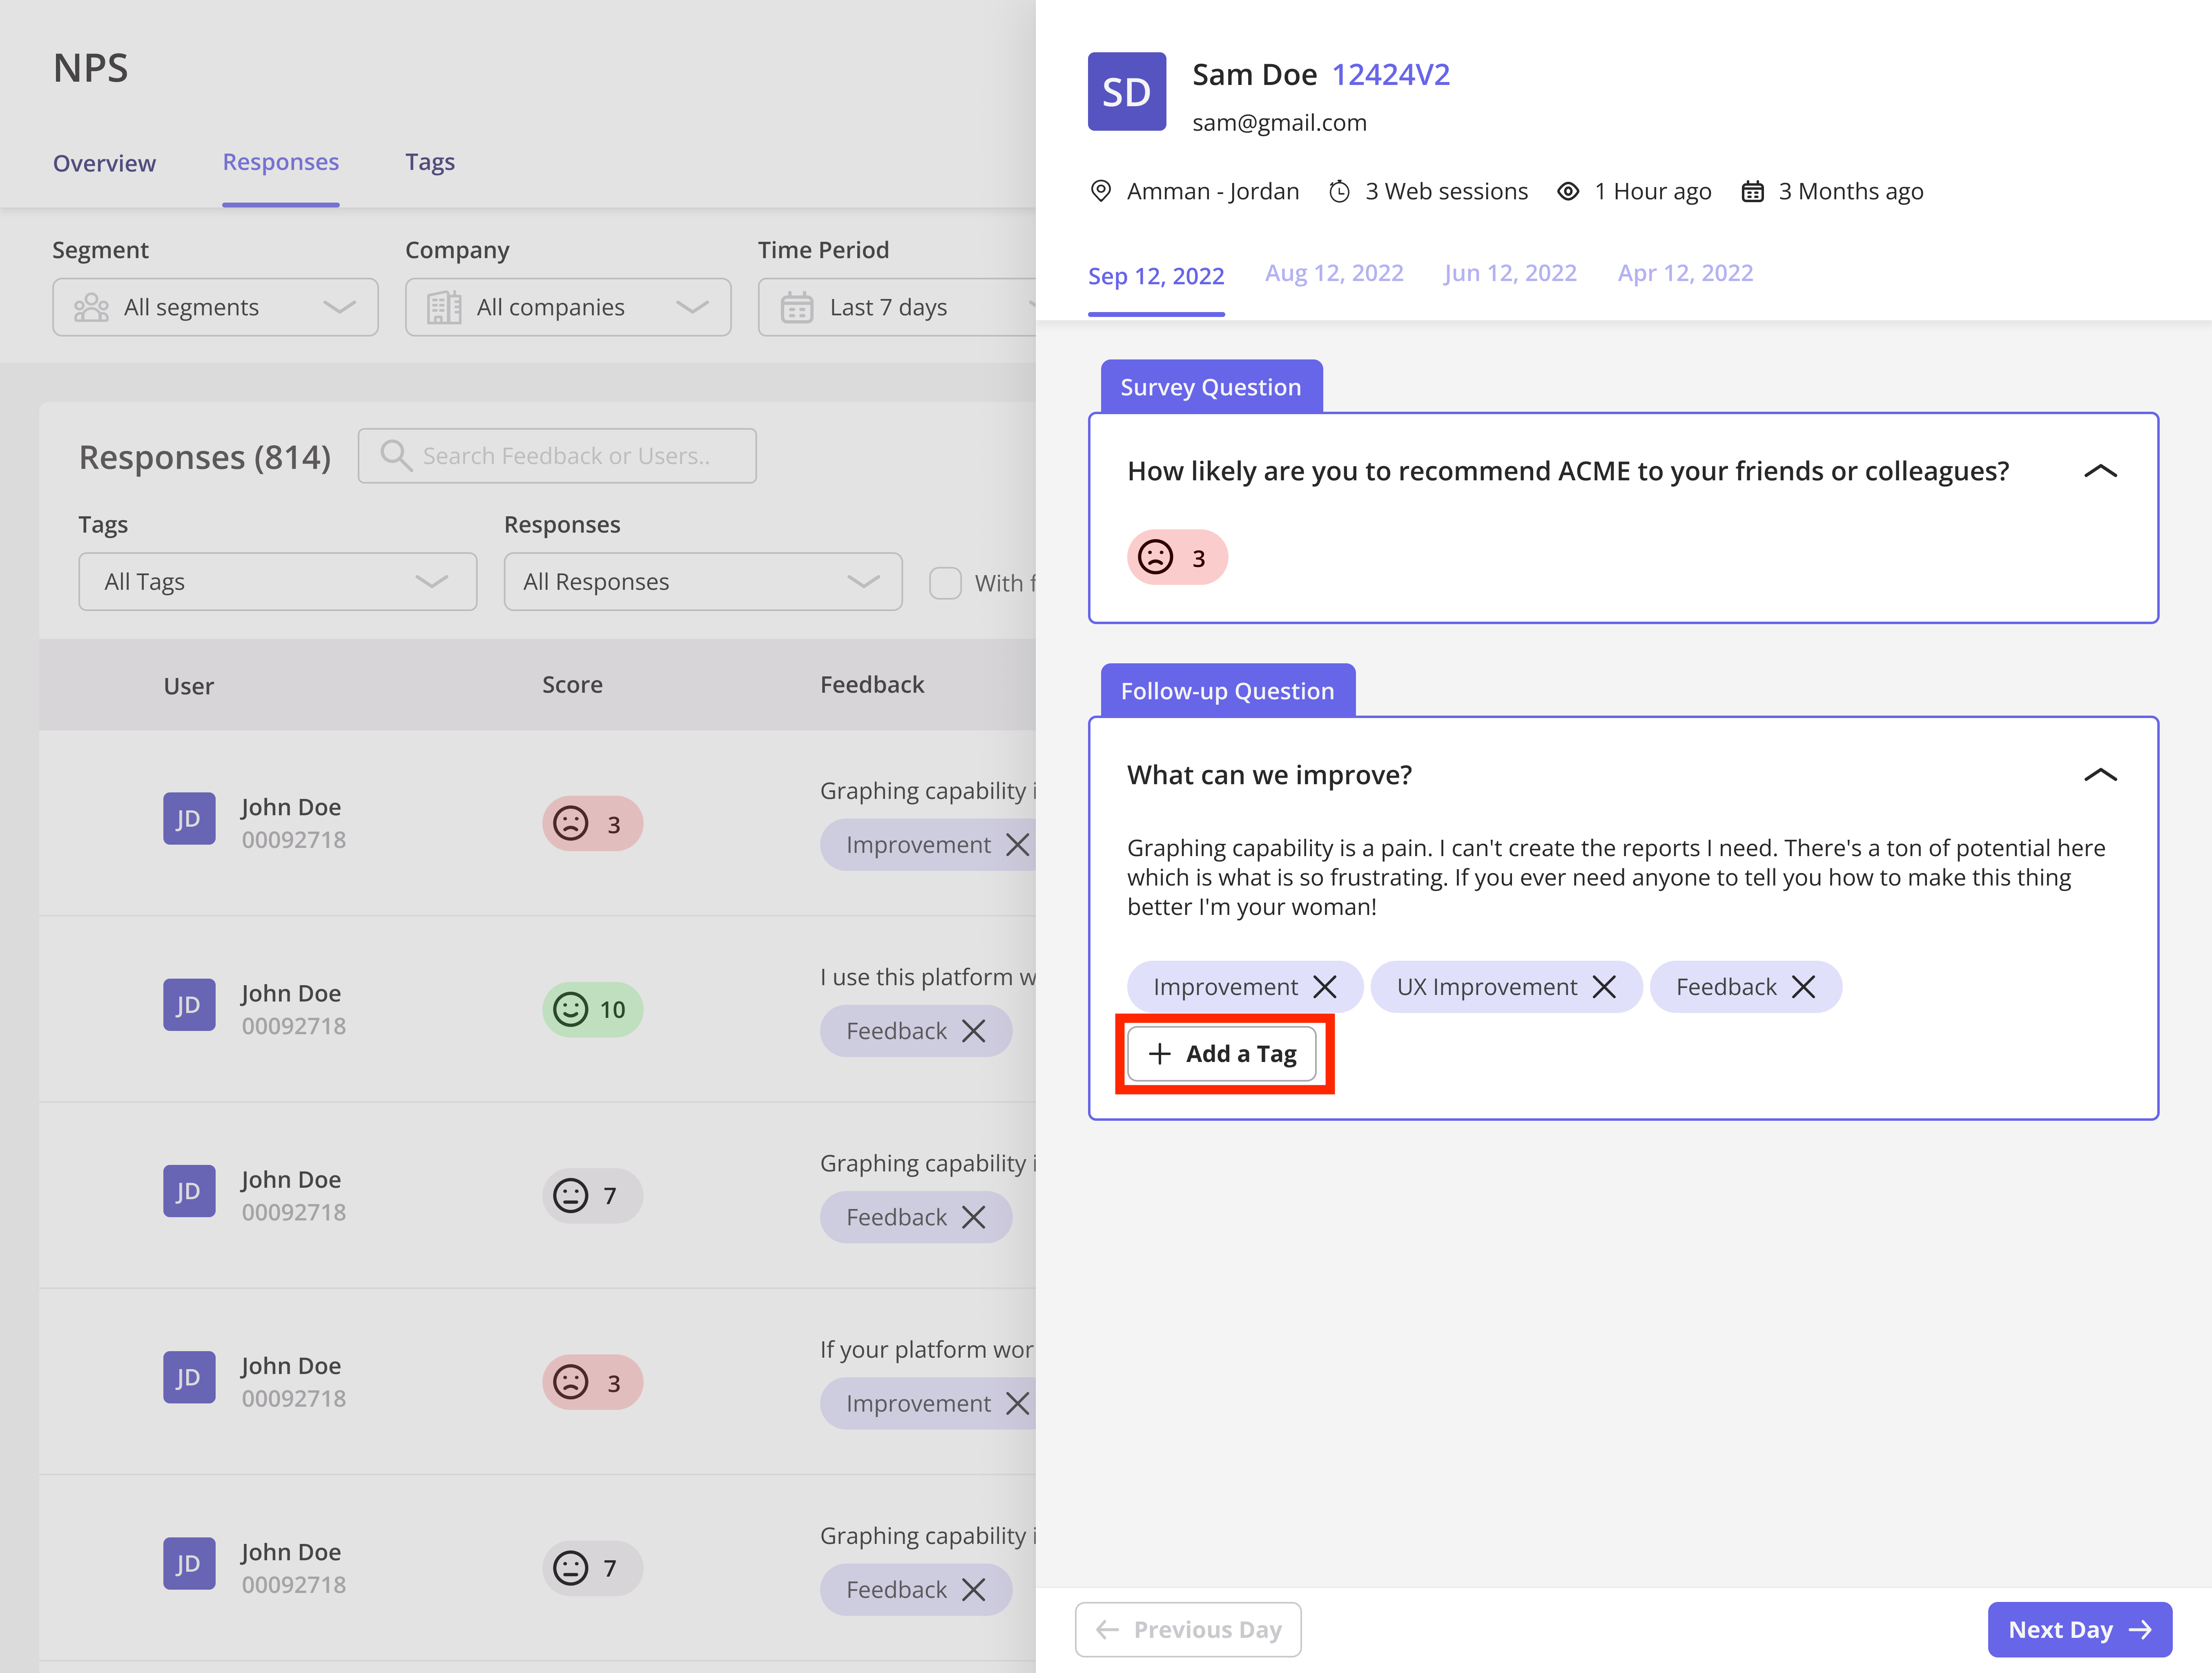
Tags
NPS tags tab helps categorize responses for better analysis. Tags Overview- Name: Rename tags via the three-dot menu.
- Responses: View the number of responses associated with a tag.
- Score Breakdown: A graphical representation of Promoters (green), Passives (grey), and Detractors (red).
- Go to the Responses tab.
- Click + Add a tag.
- Enter a name or select an existing tag.
FAQs
What happens when I exclude a response?
What happens when I exclude a response?
It is removed from NPS analytics but remains visible in the response log.
If a user submits an NPS score but doesn't enter any comments, will the NPS score be triggered again?
If a user submits an NPS score but doesn't enter any comments, will the NPS score be triggered again?
A user doesn’t have to submit text feedback for the score to be counted. If someone submits an NPS score without a response, it re-triggers after 60 days; 60 days is the default setting and can be changed.
How can I increase my NPS score?
How can I increase my NPS score?
Address detractor concerns, engage passives, and reward promoters for referrals.