Survey Overview
Userpilot surveys allow you to collect valuable feedback at scale and at the right moment. Whether you aim to improve the user experience, measure satisfaction, gather feedback on new features, or segment your users, this tool provides a dynamic and flexible approach to collecting insights.The Survey feature is included with Growth and Enterprise plans.
- Overview Tab
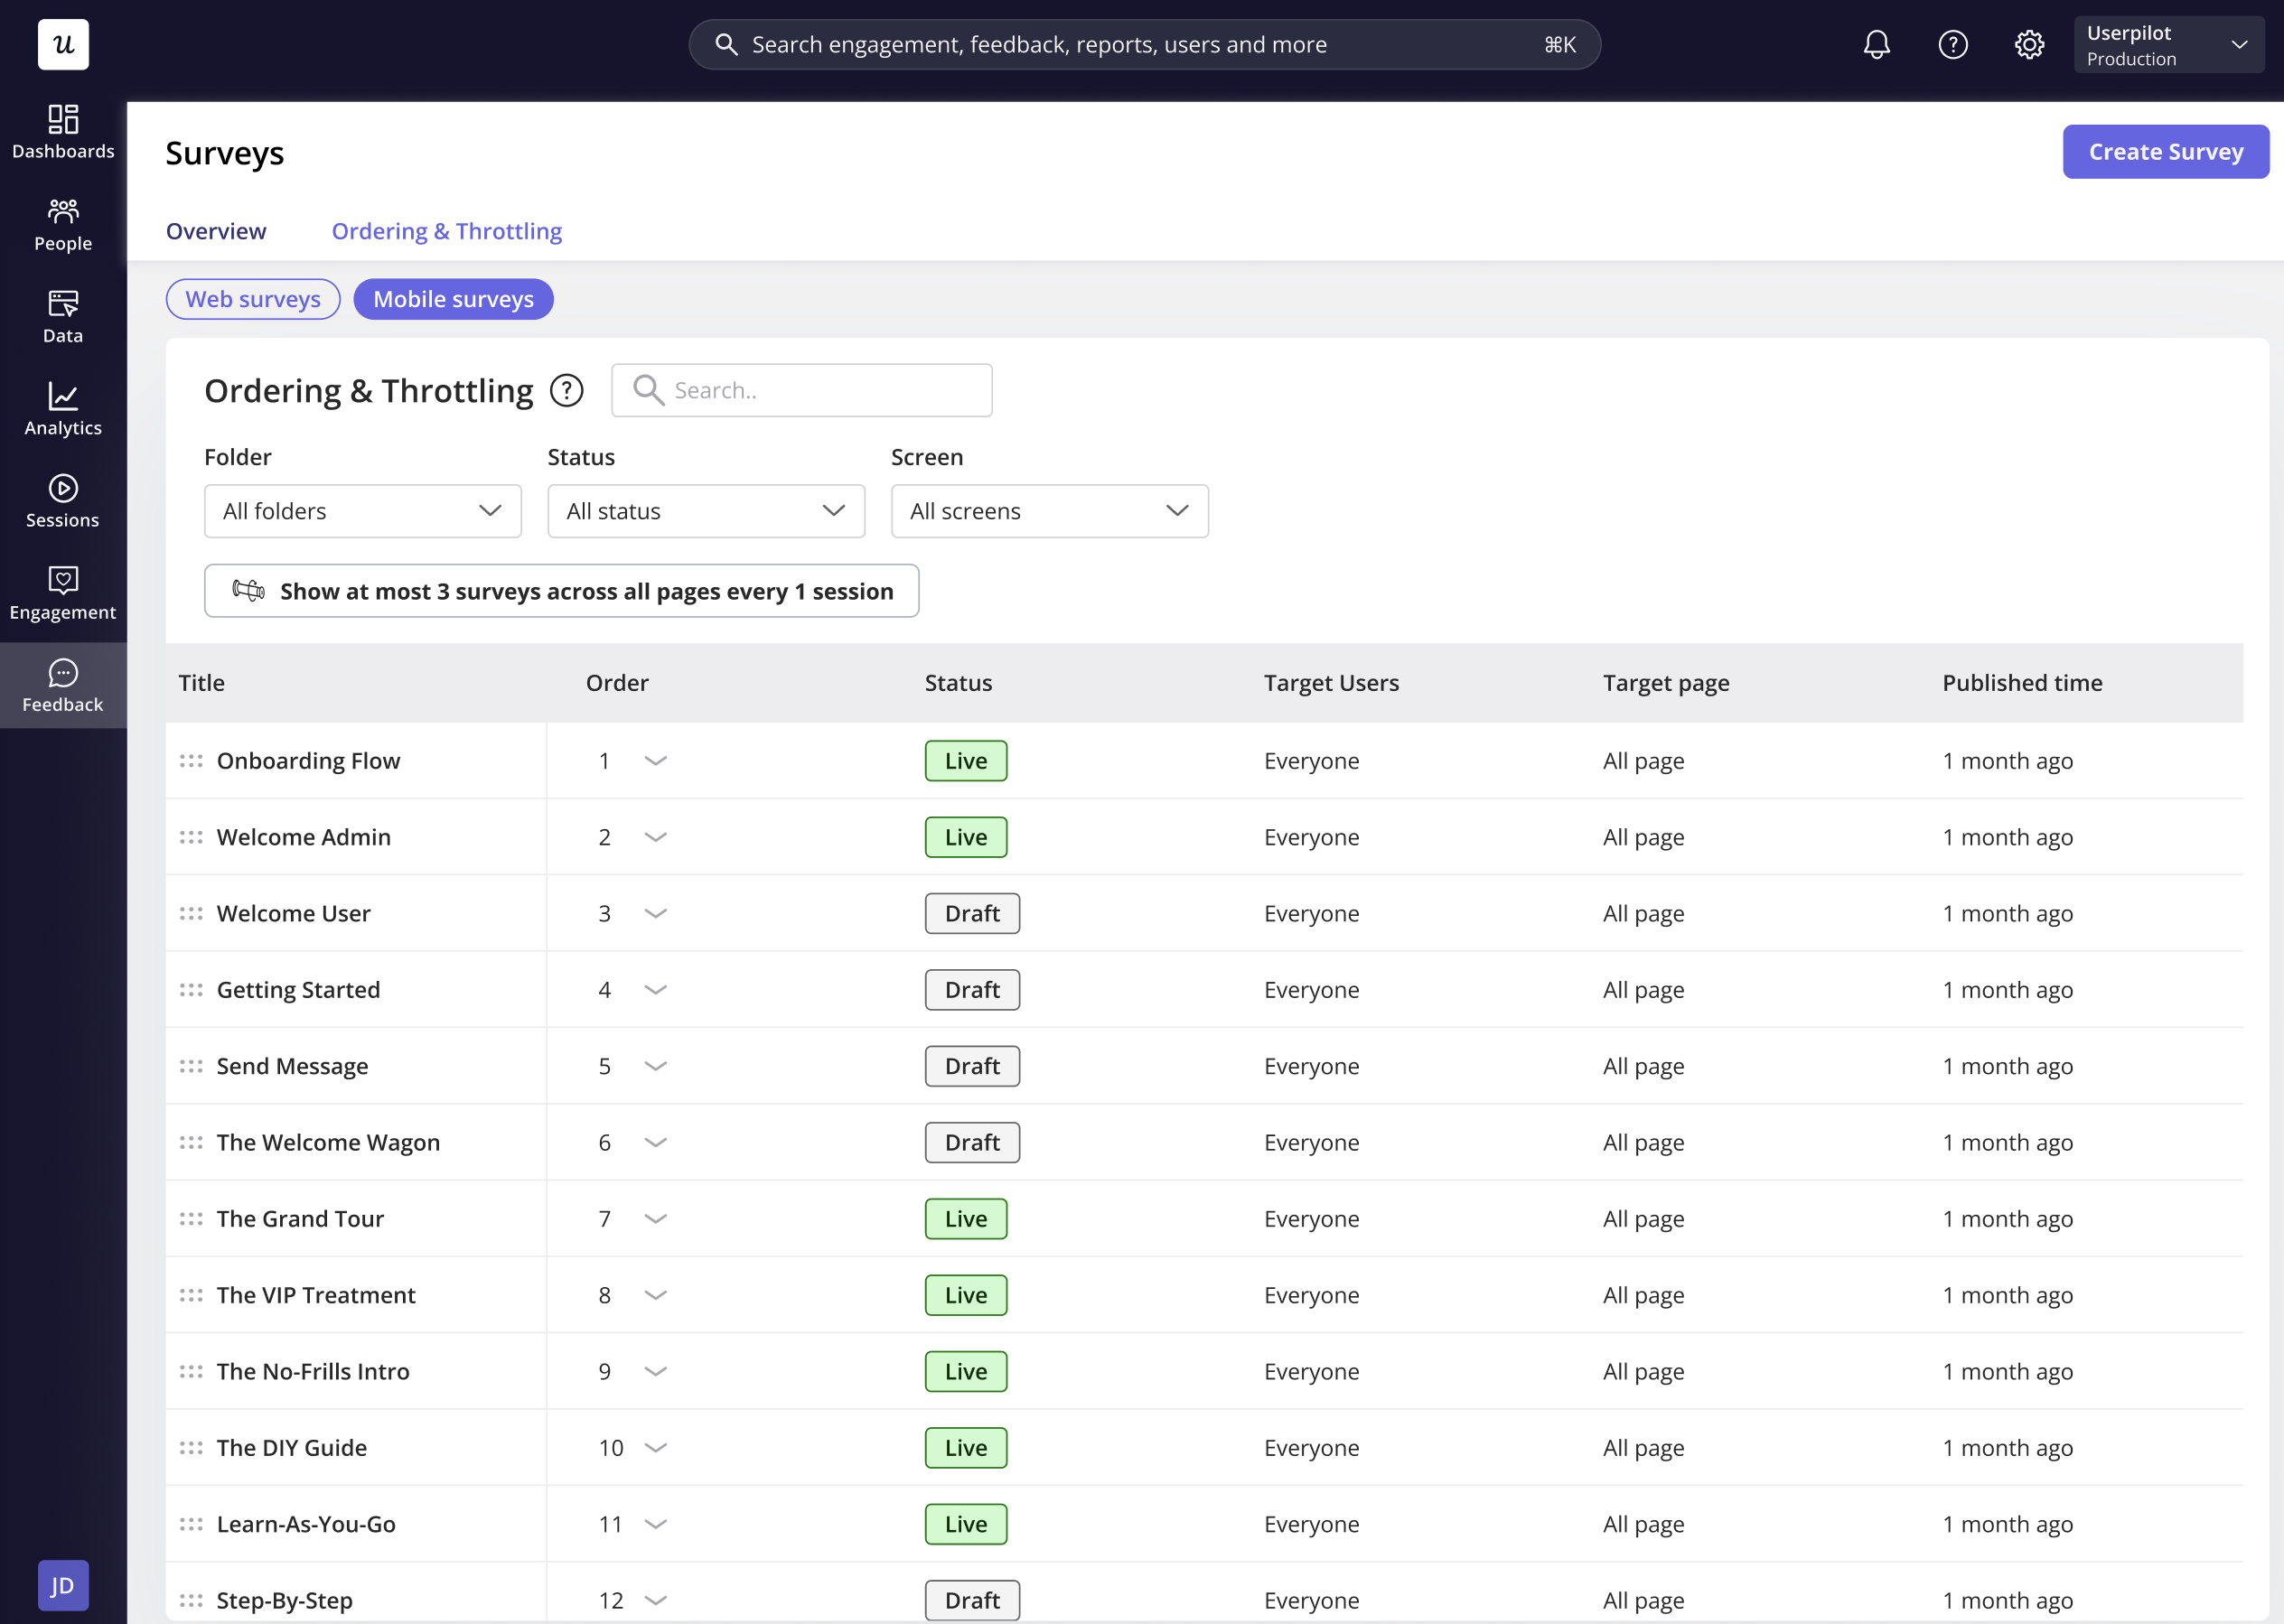
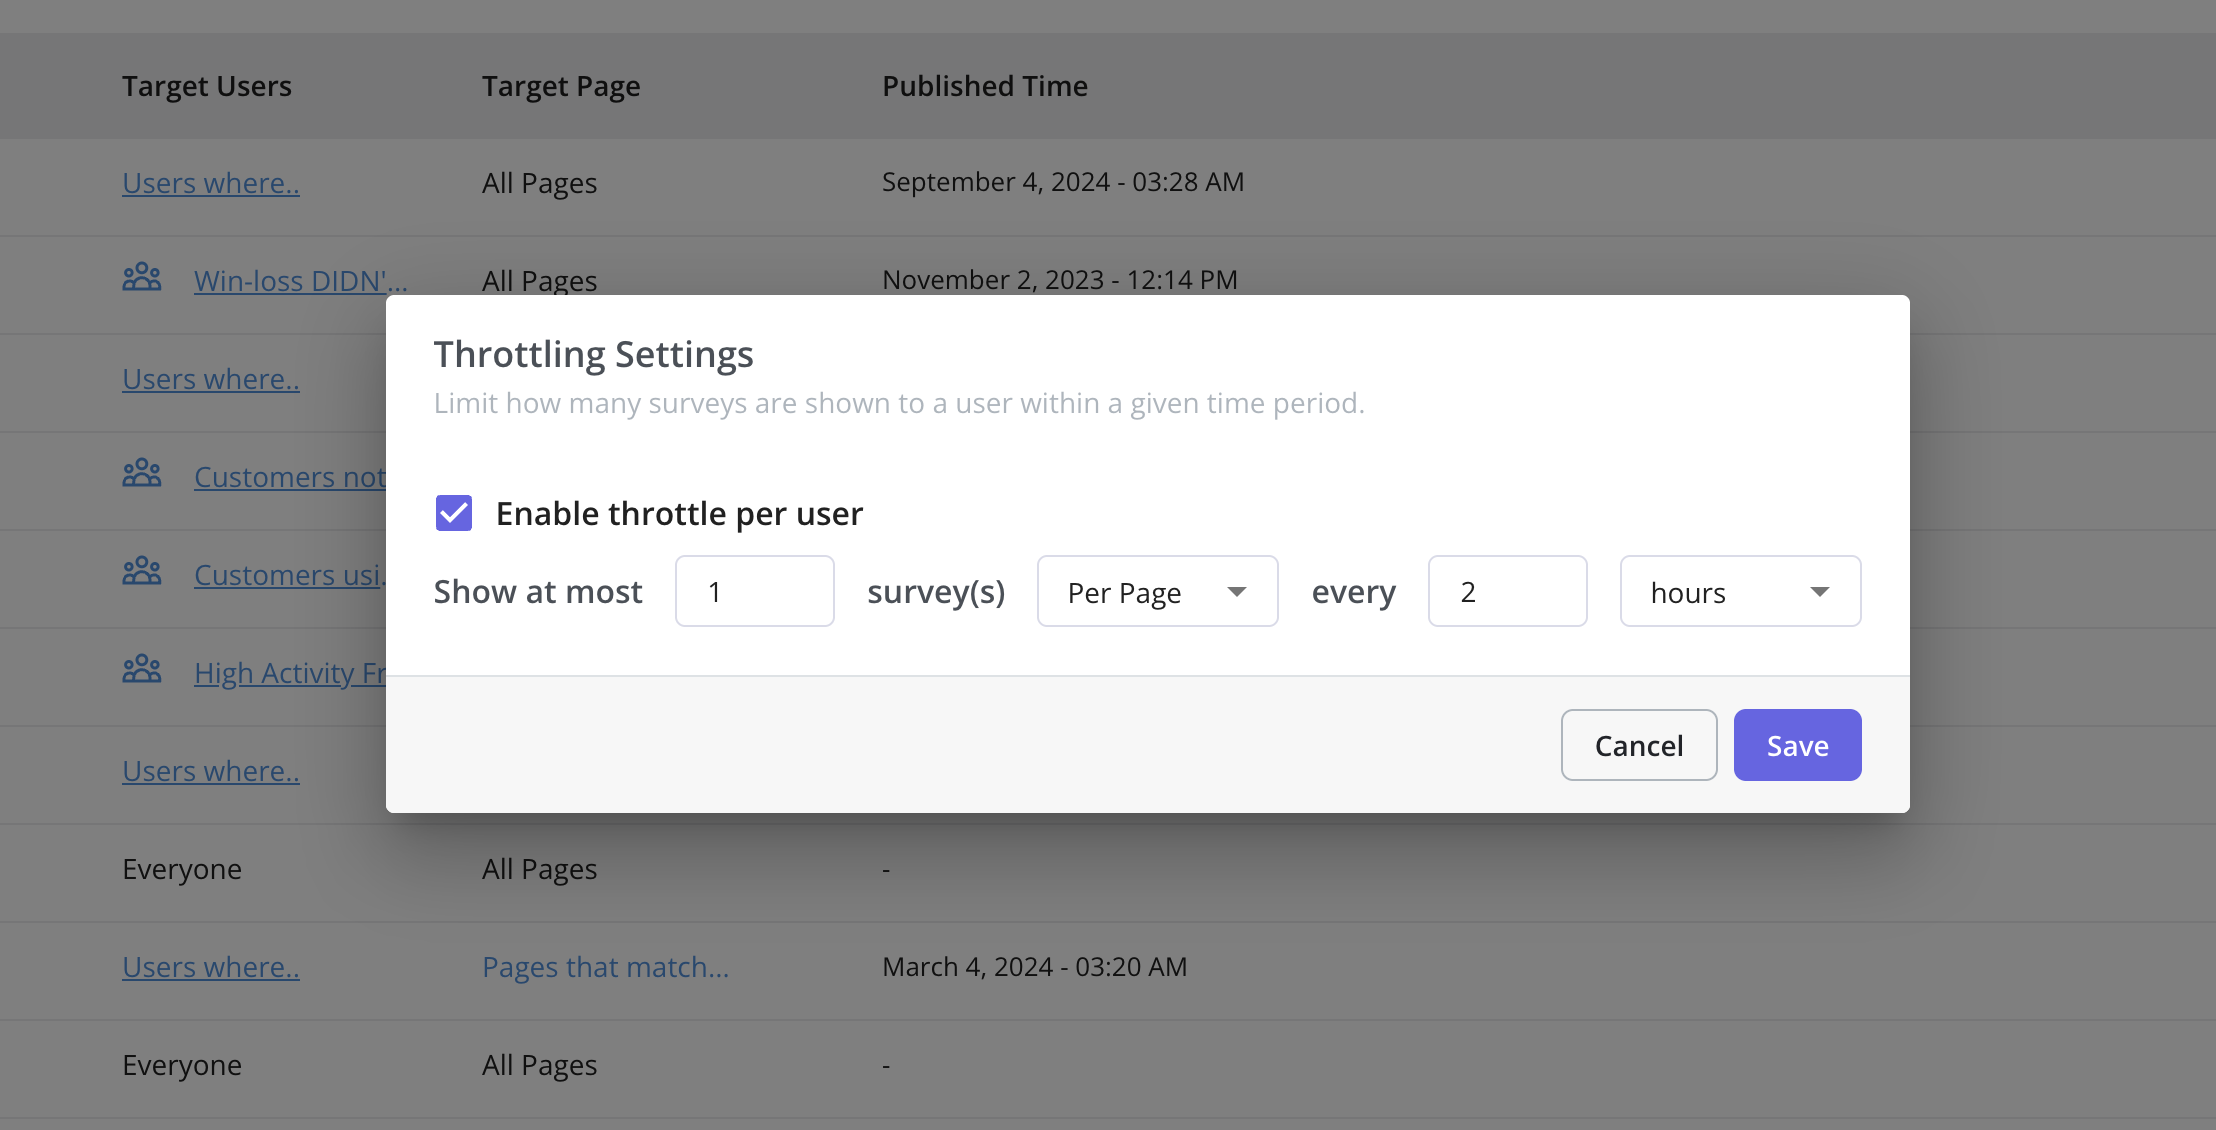
- Ordering & Throttling
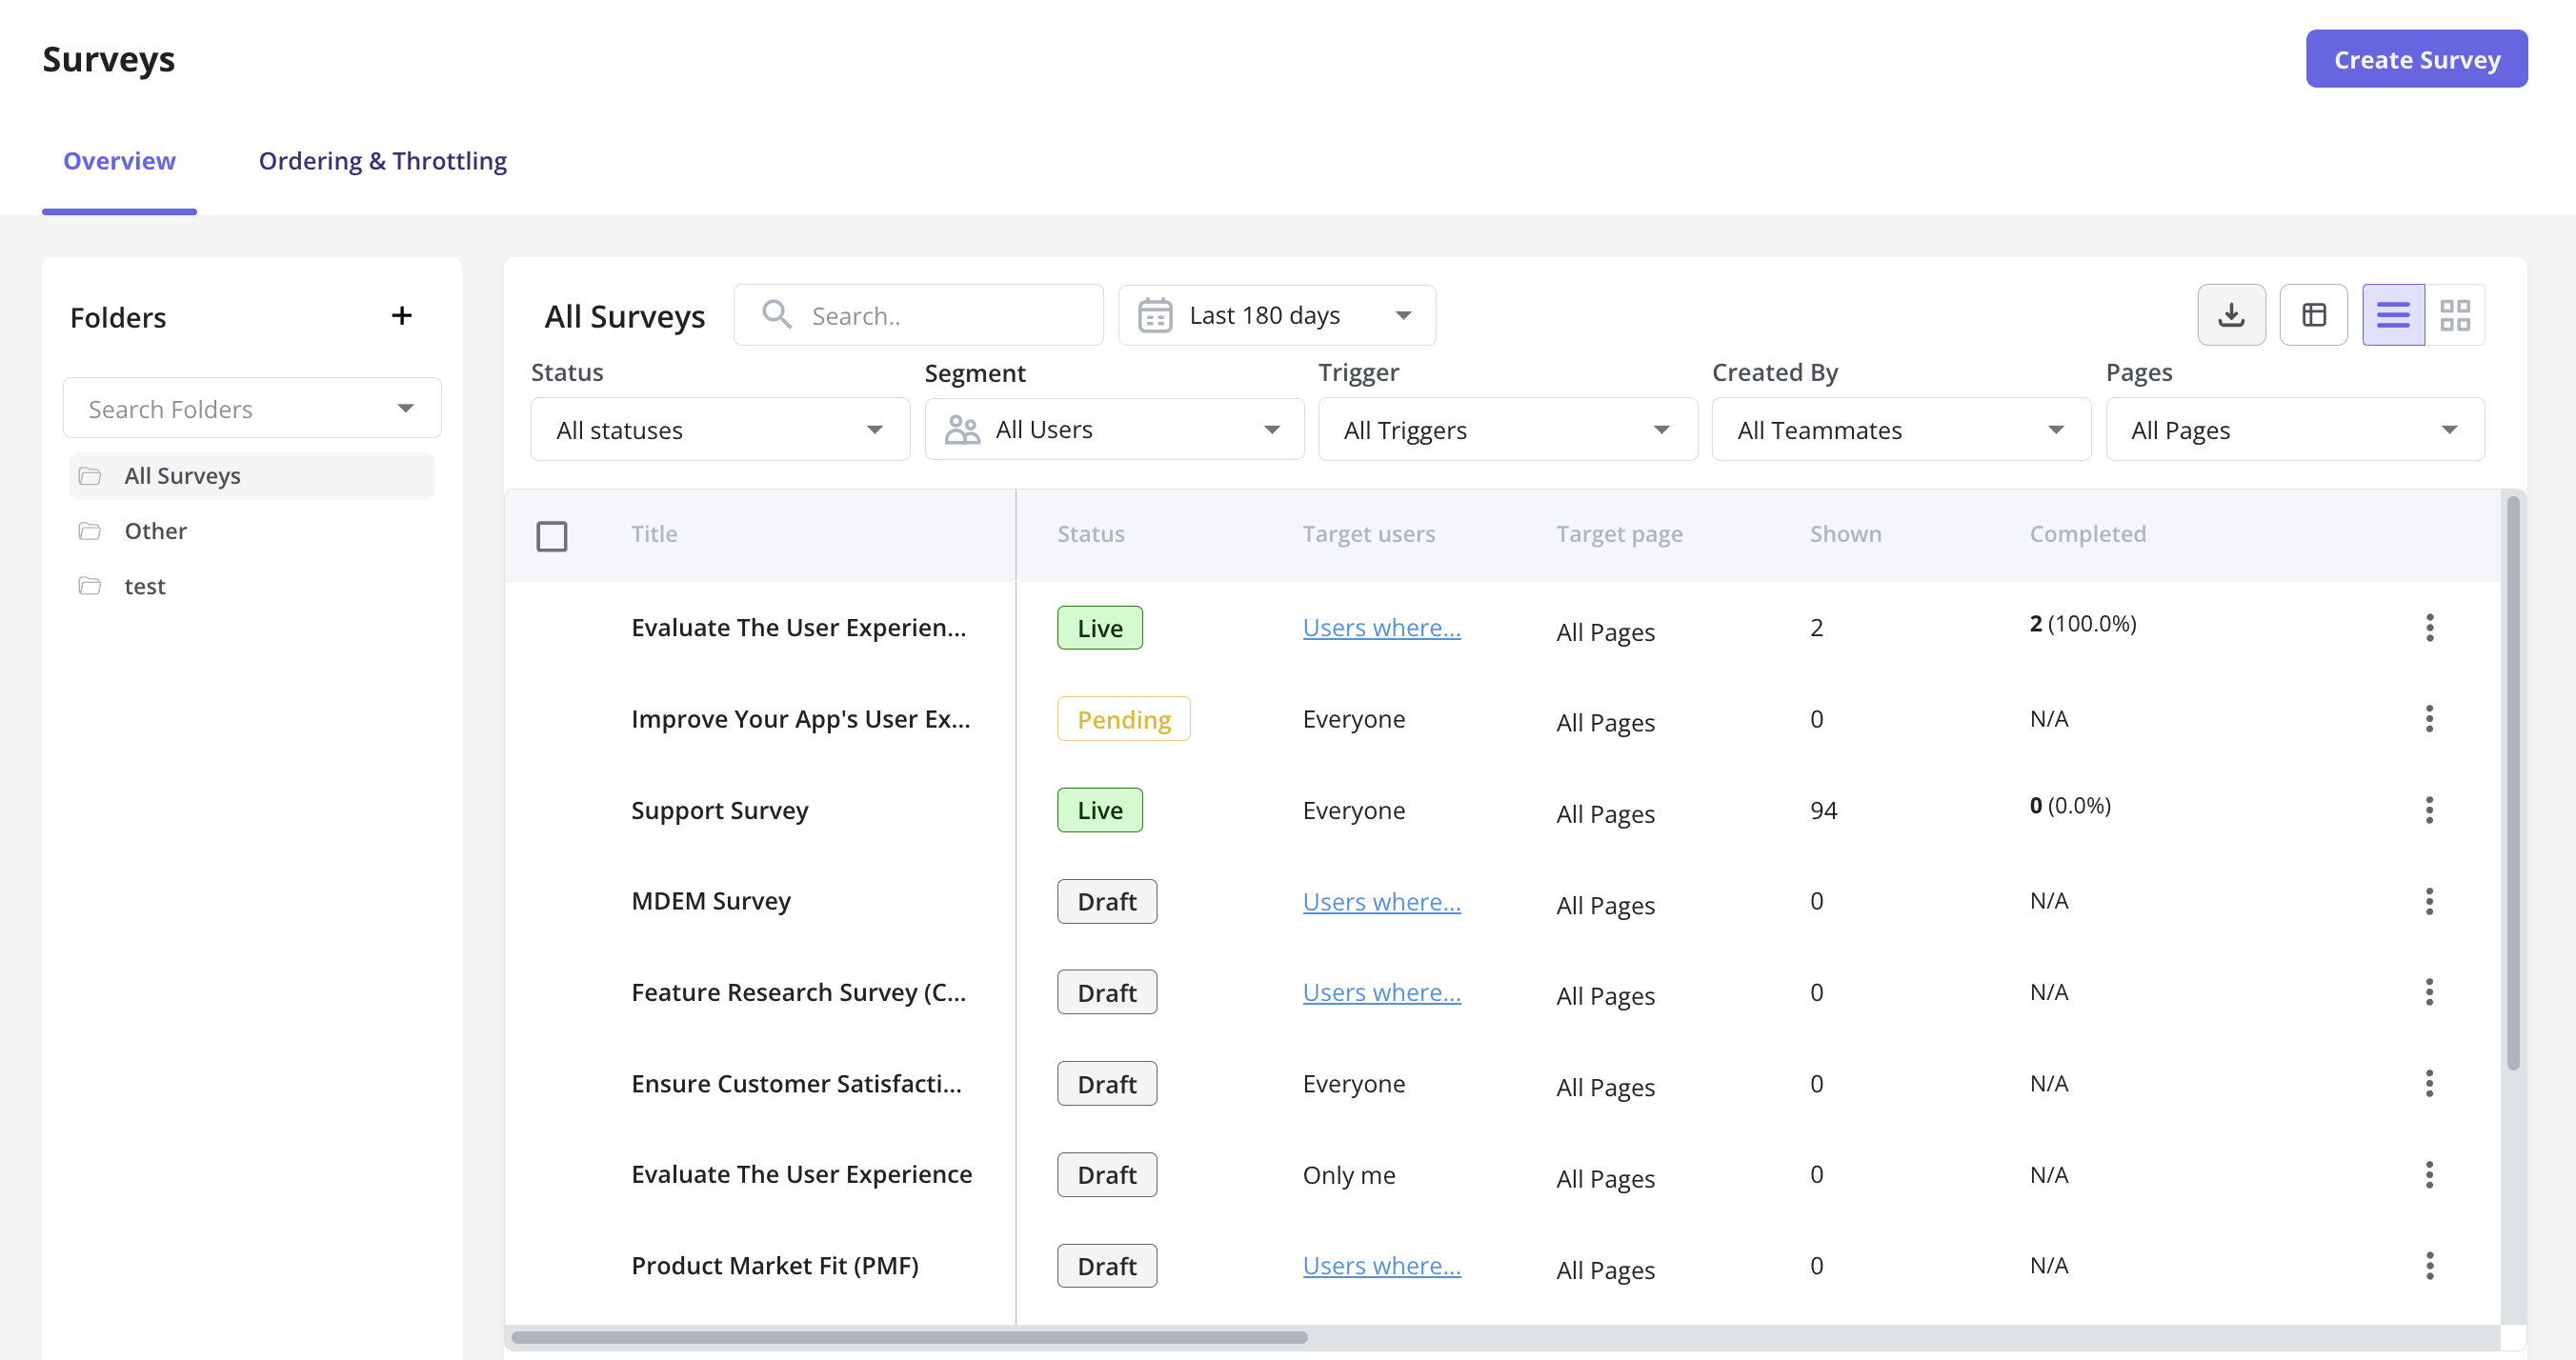
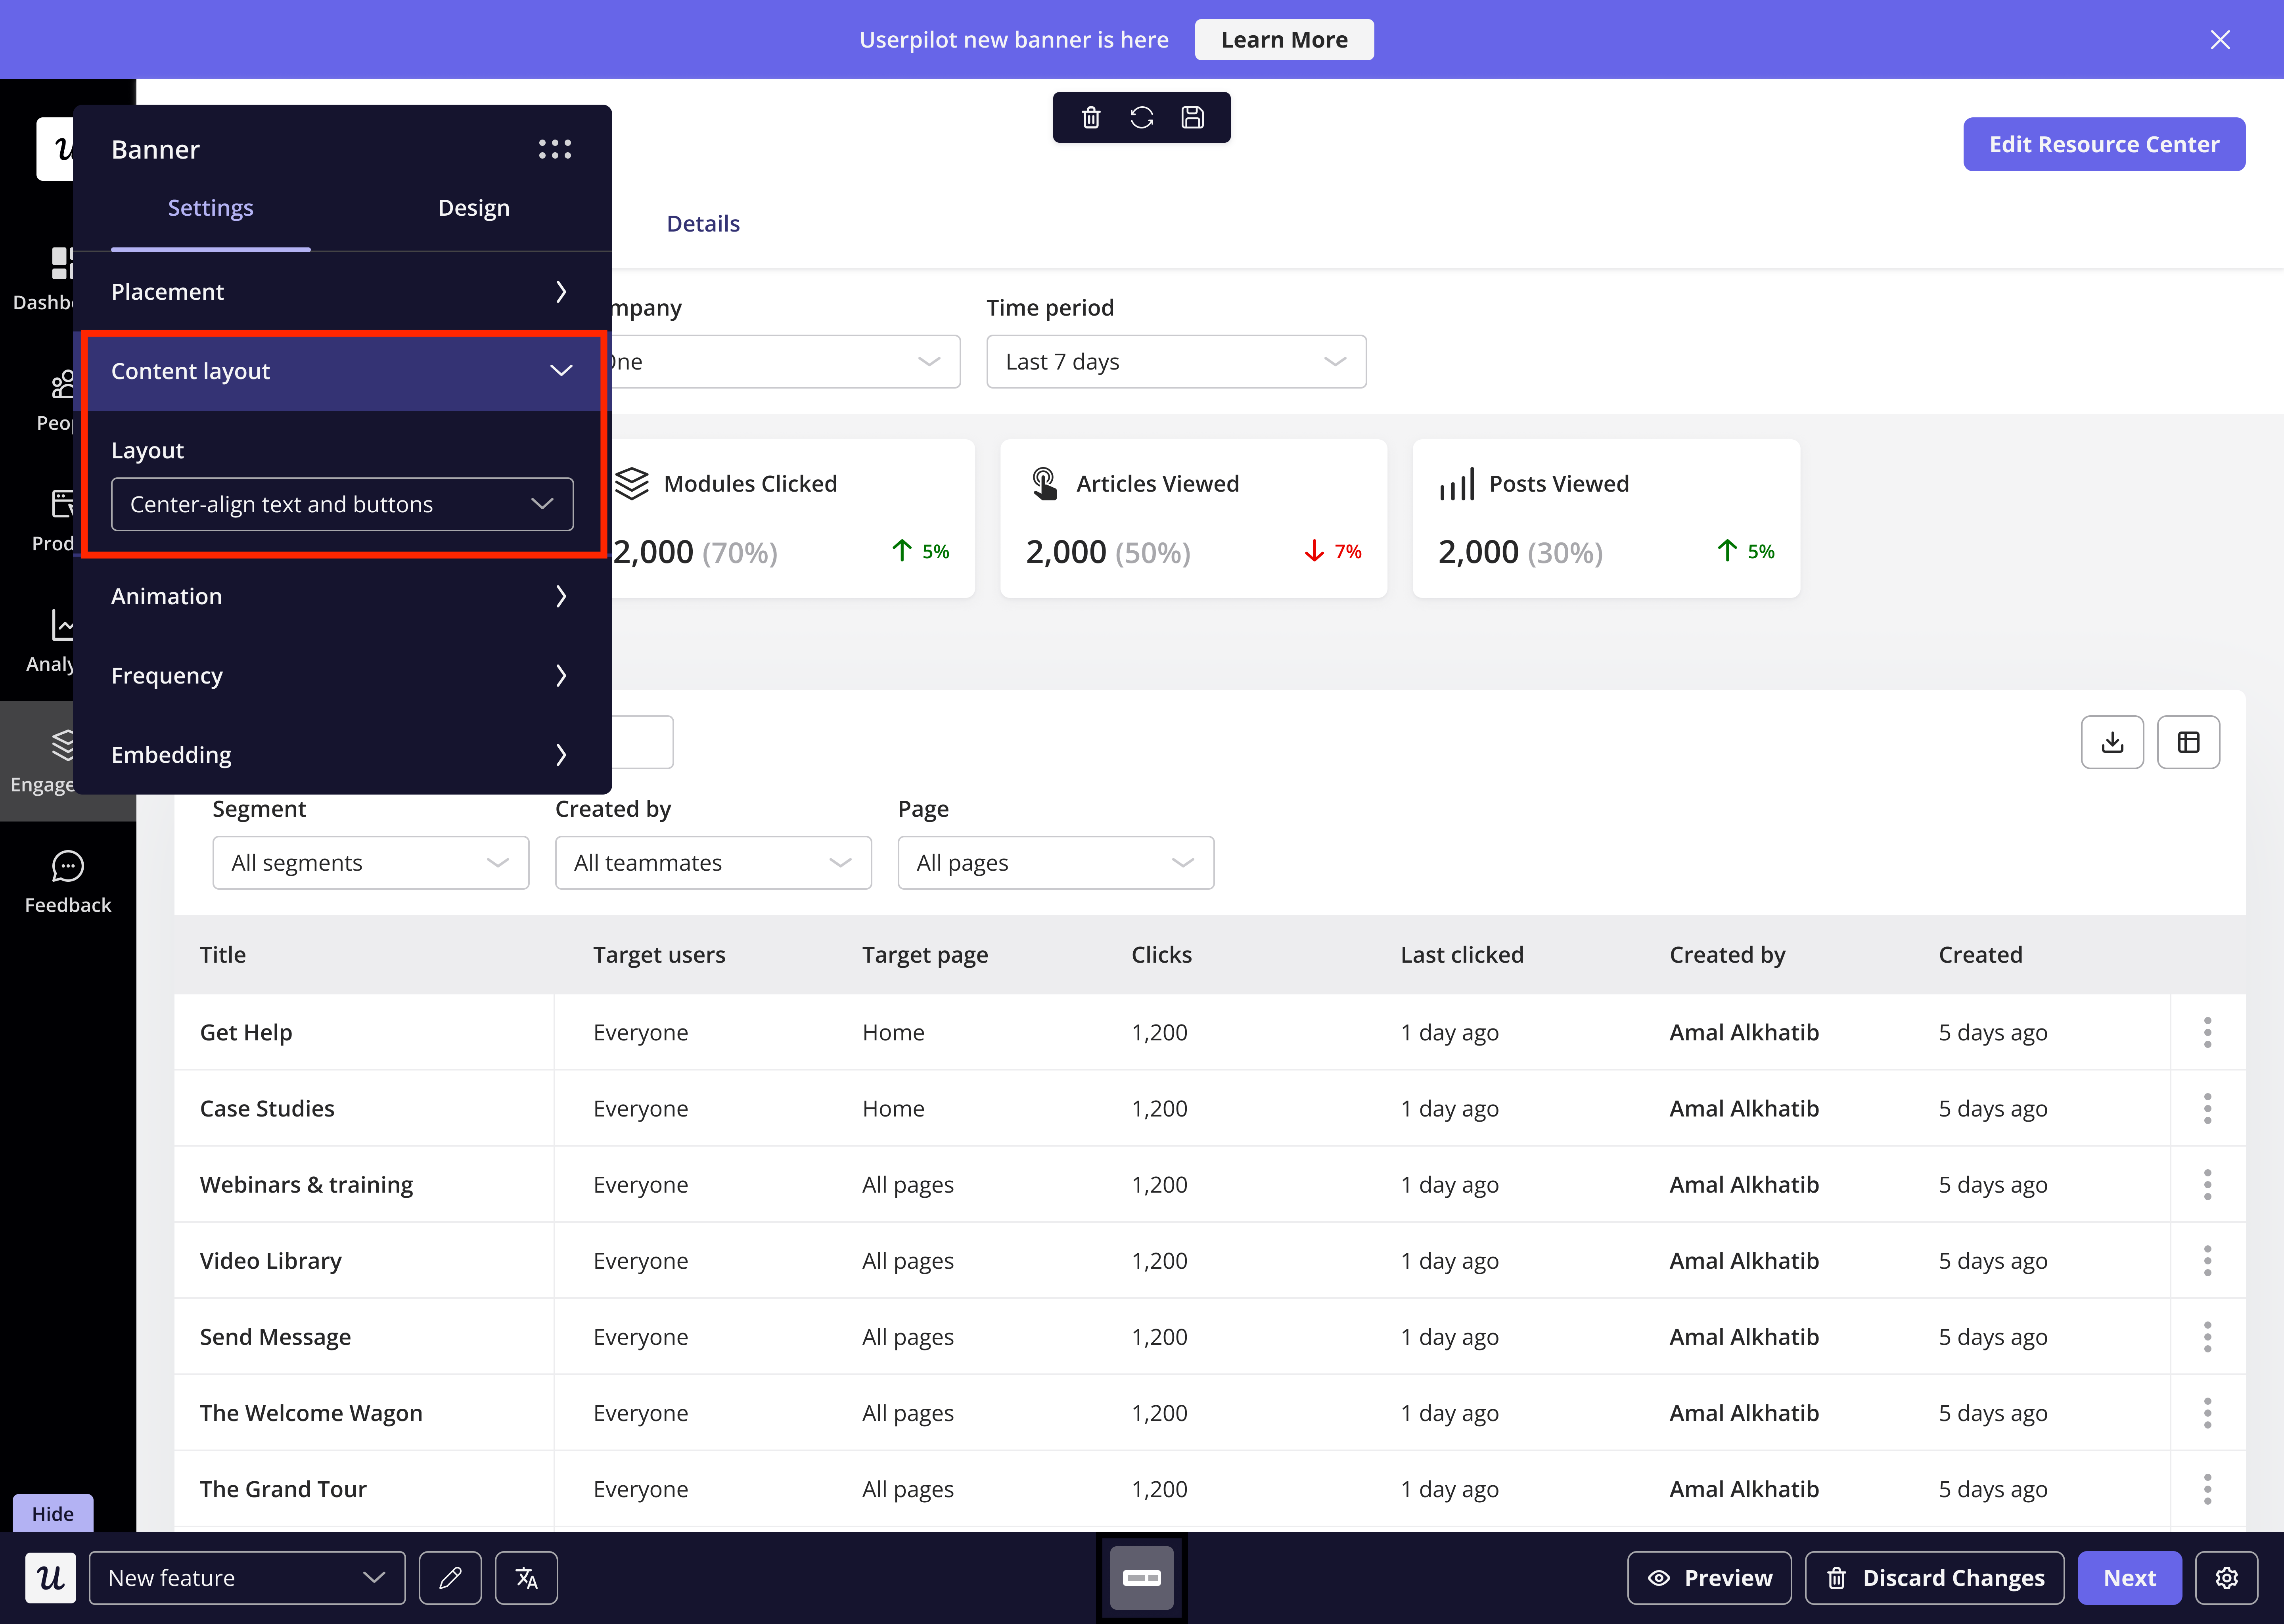
The Survey Overview serves as your central hub for monitoring and analyzing survey performance. Once you access this dashboard, you’ll find:What Can You Do in the Overview Tab?
- View & Manage Surveys Easily access and view all surveys in your workspace, with key details like title, trigger type, and status (Active, Draft, Archived).
- Organize & Filter Surveys Filter by status, trigger type, target segment, or creator to quickly find relevant surveys.
- Customize Your Data Reorder columns, show/hide data, and sort by different attributes to focus on key metrics.
-
Export Surveys Download a report in CSV file to analyze and share survey data.
Creating a Survey
- Content
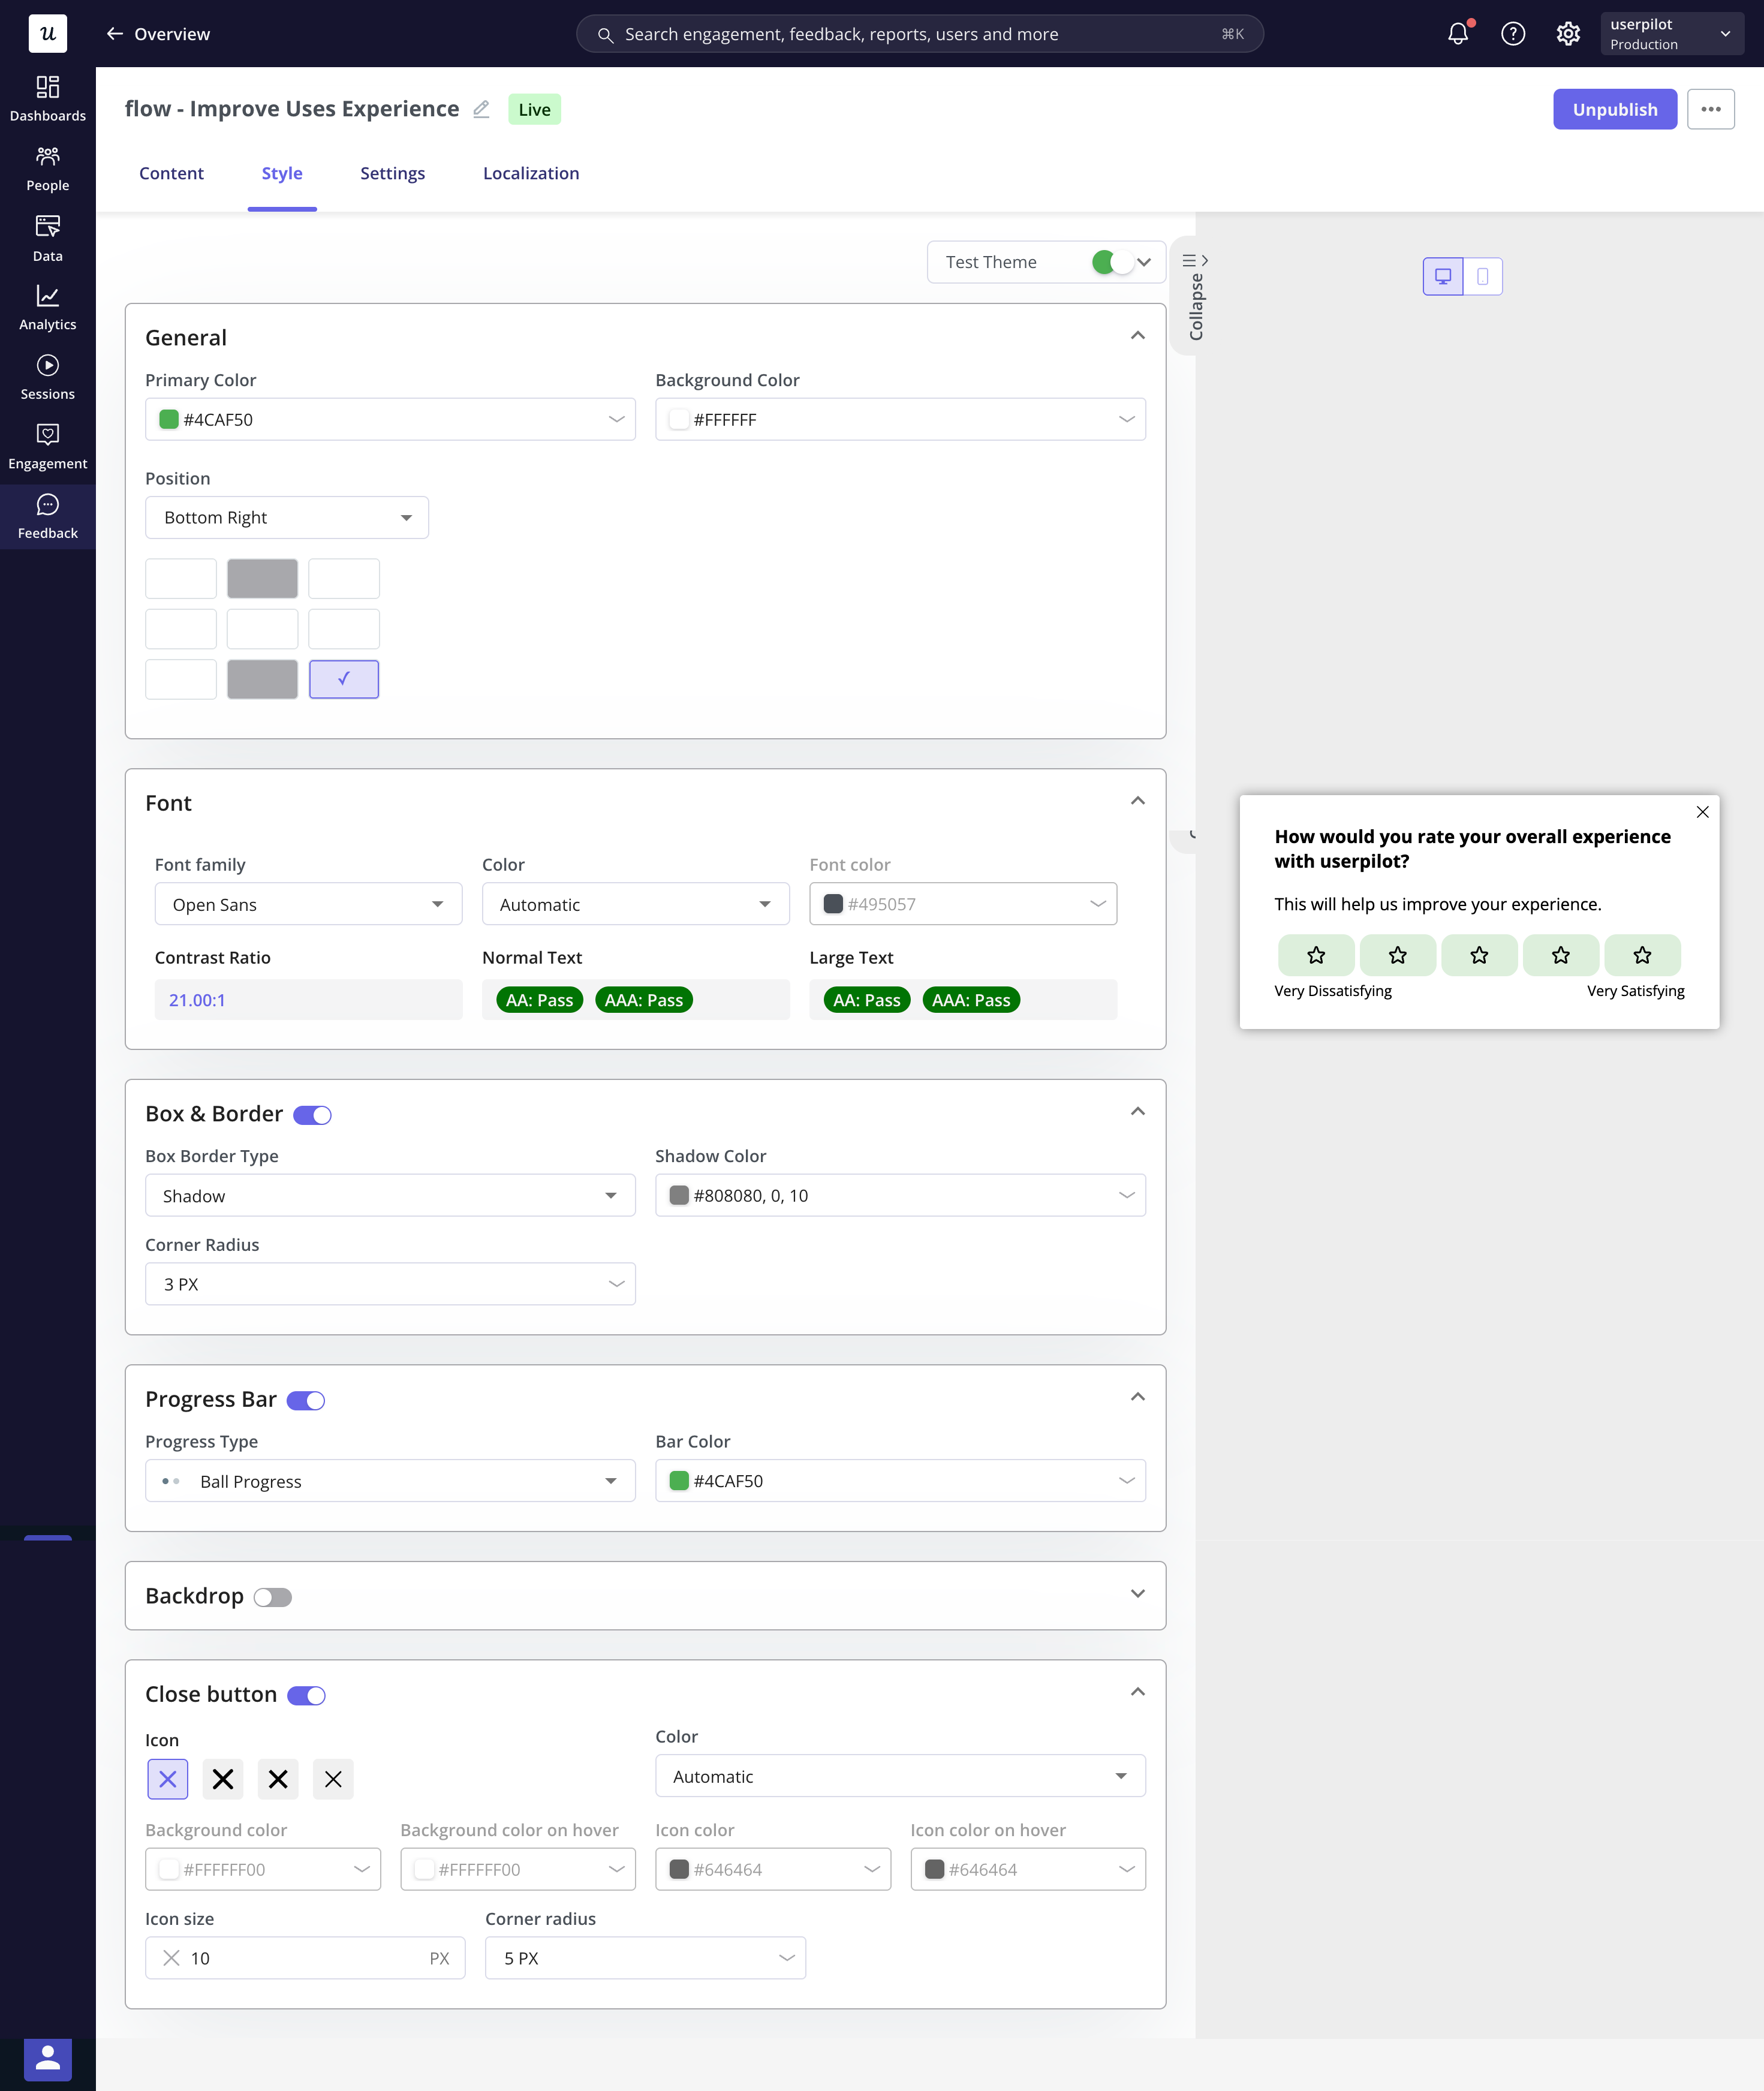
- Style
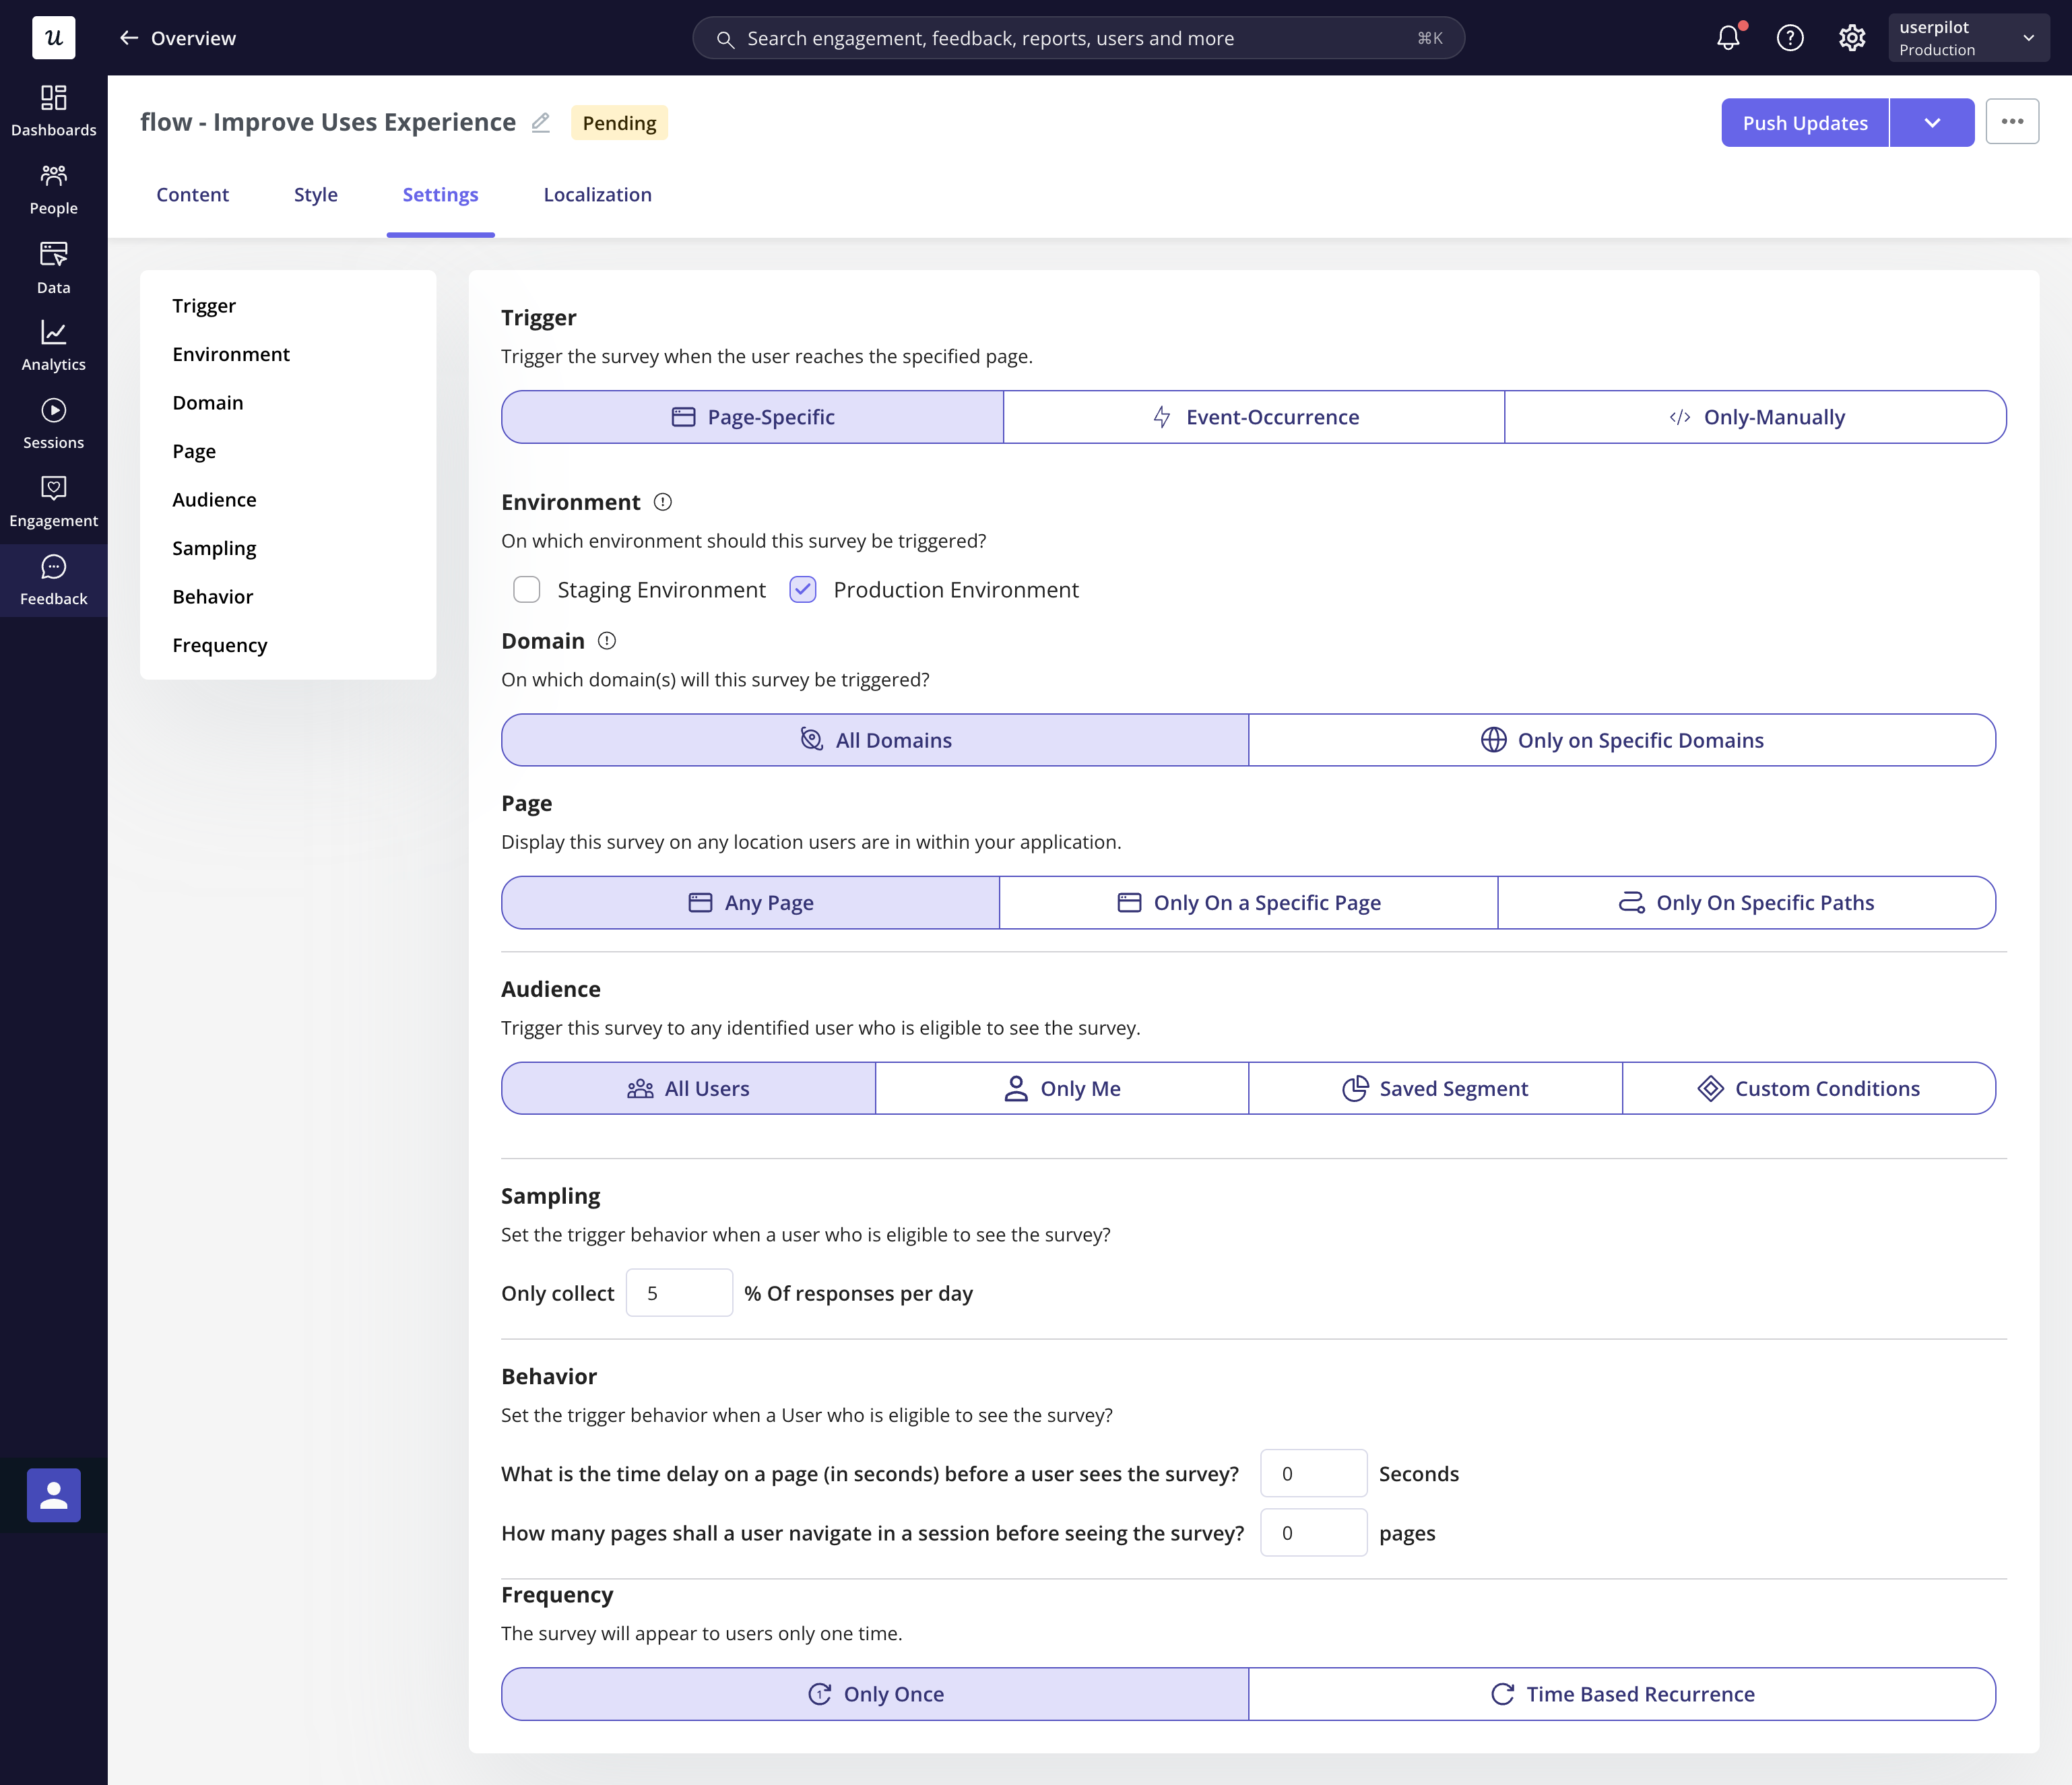
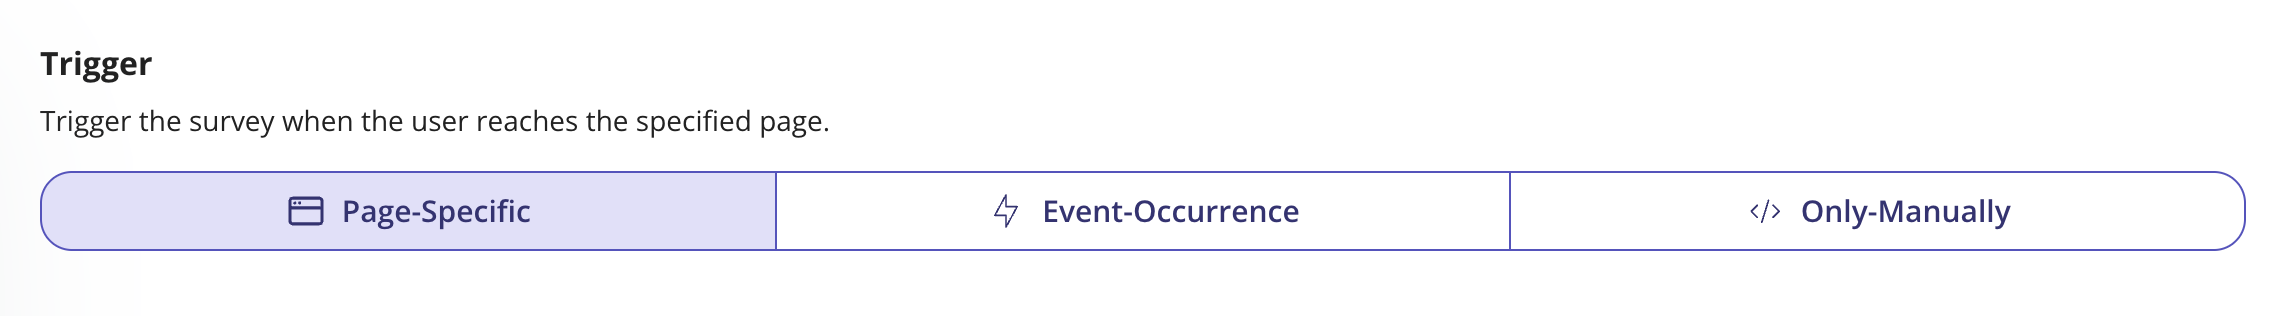
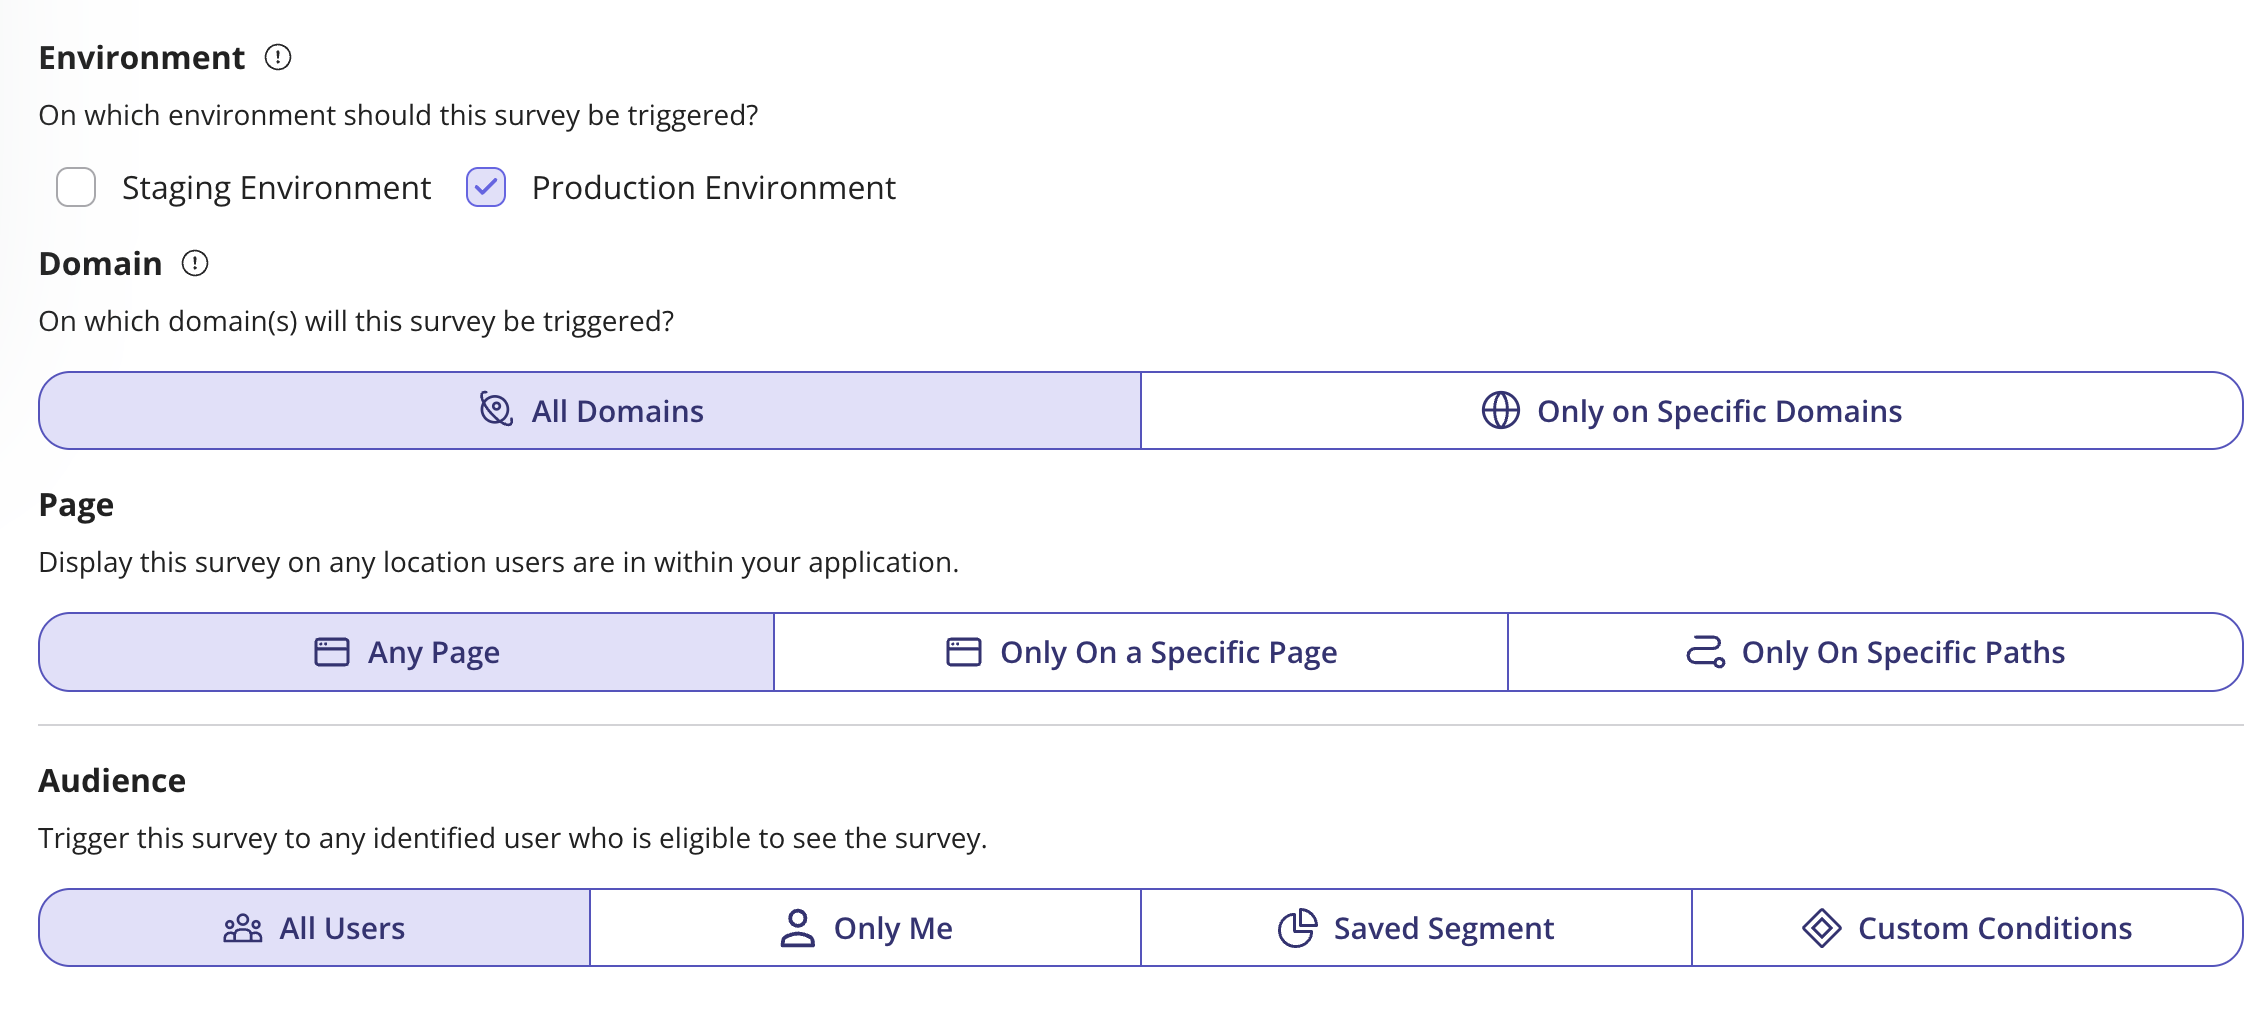
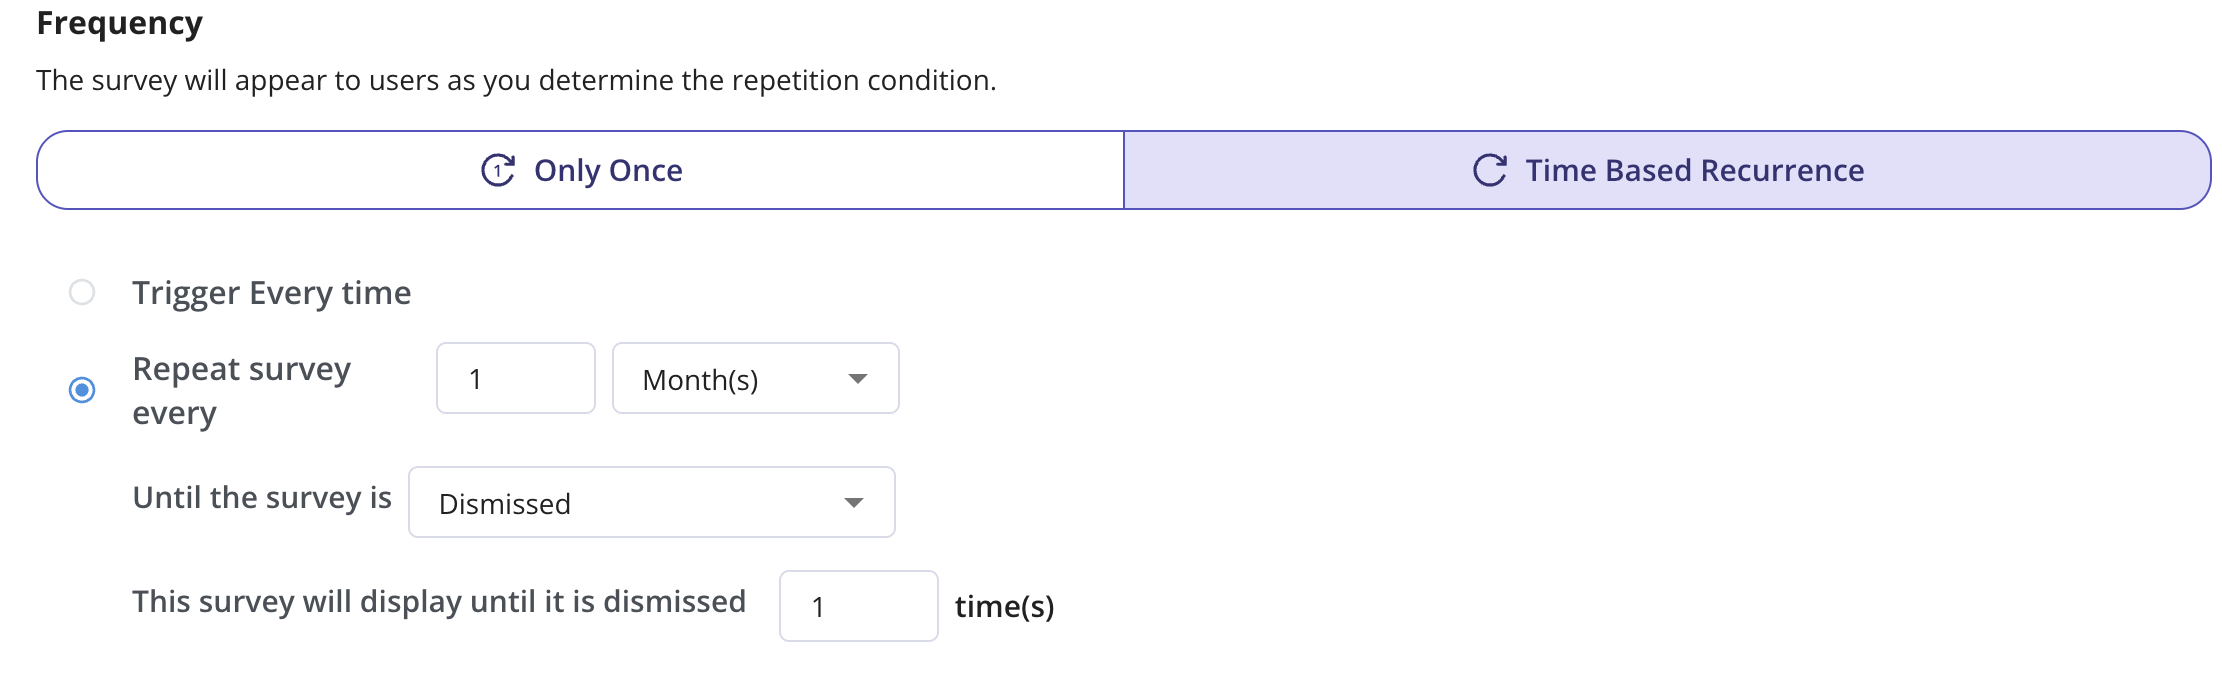
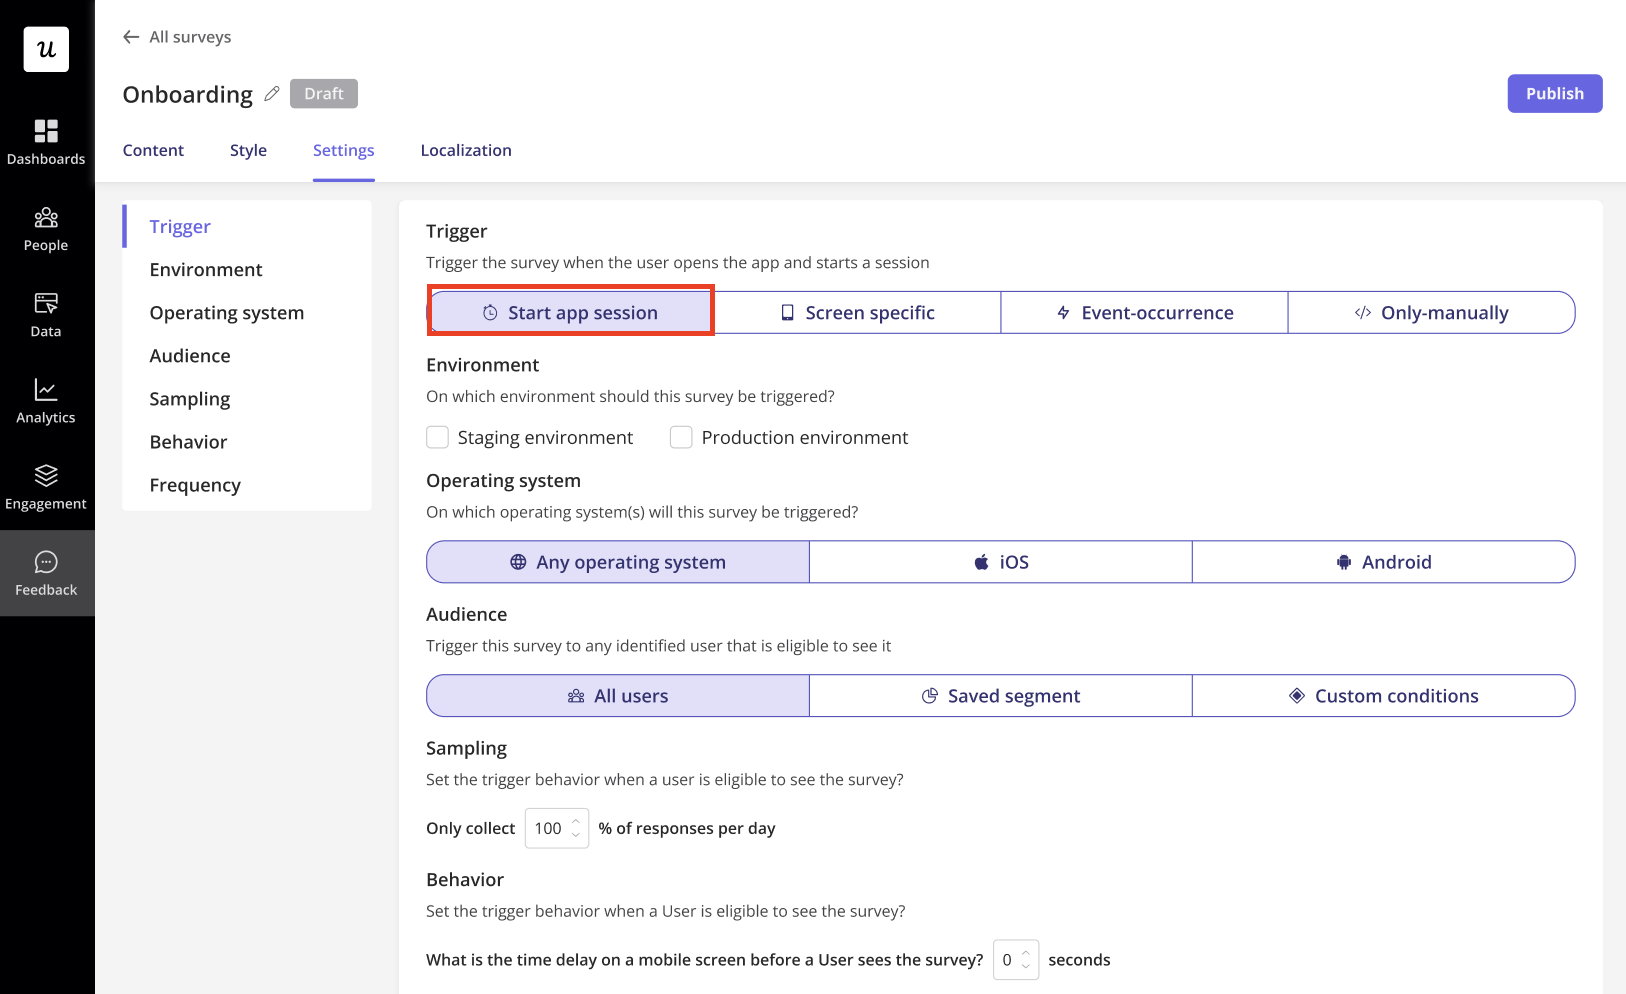
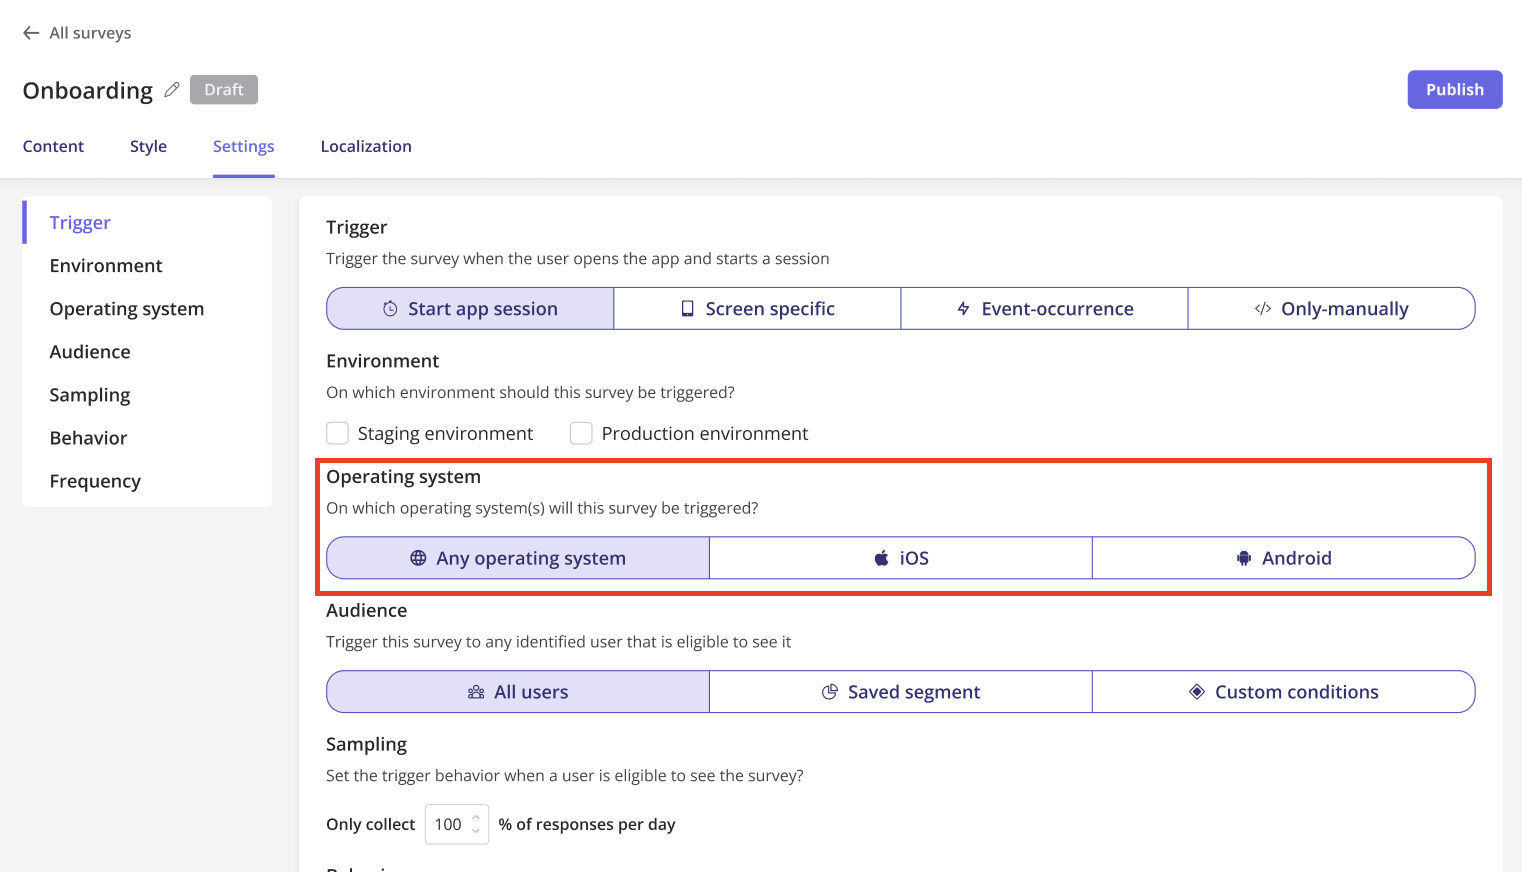
- Settings
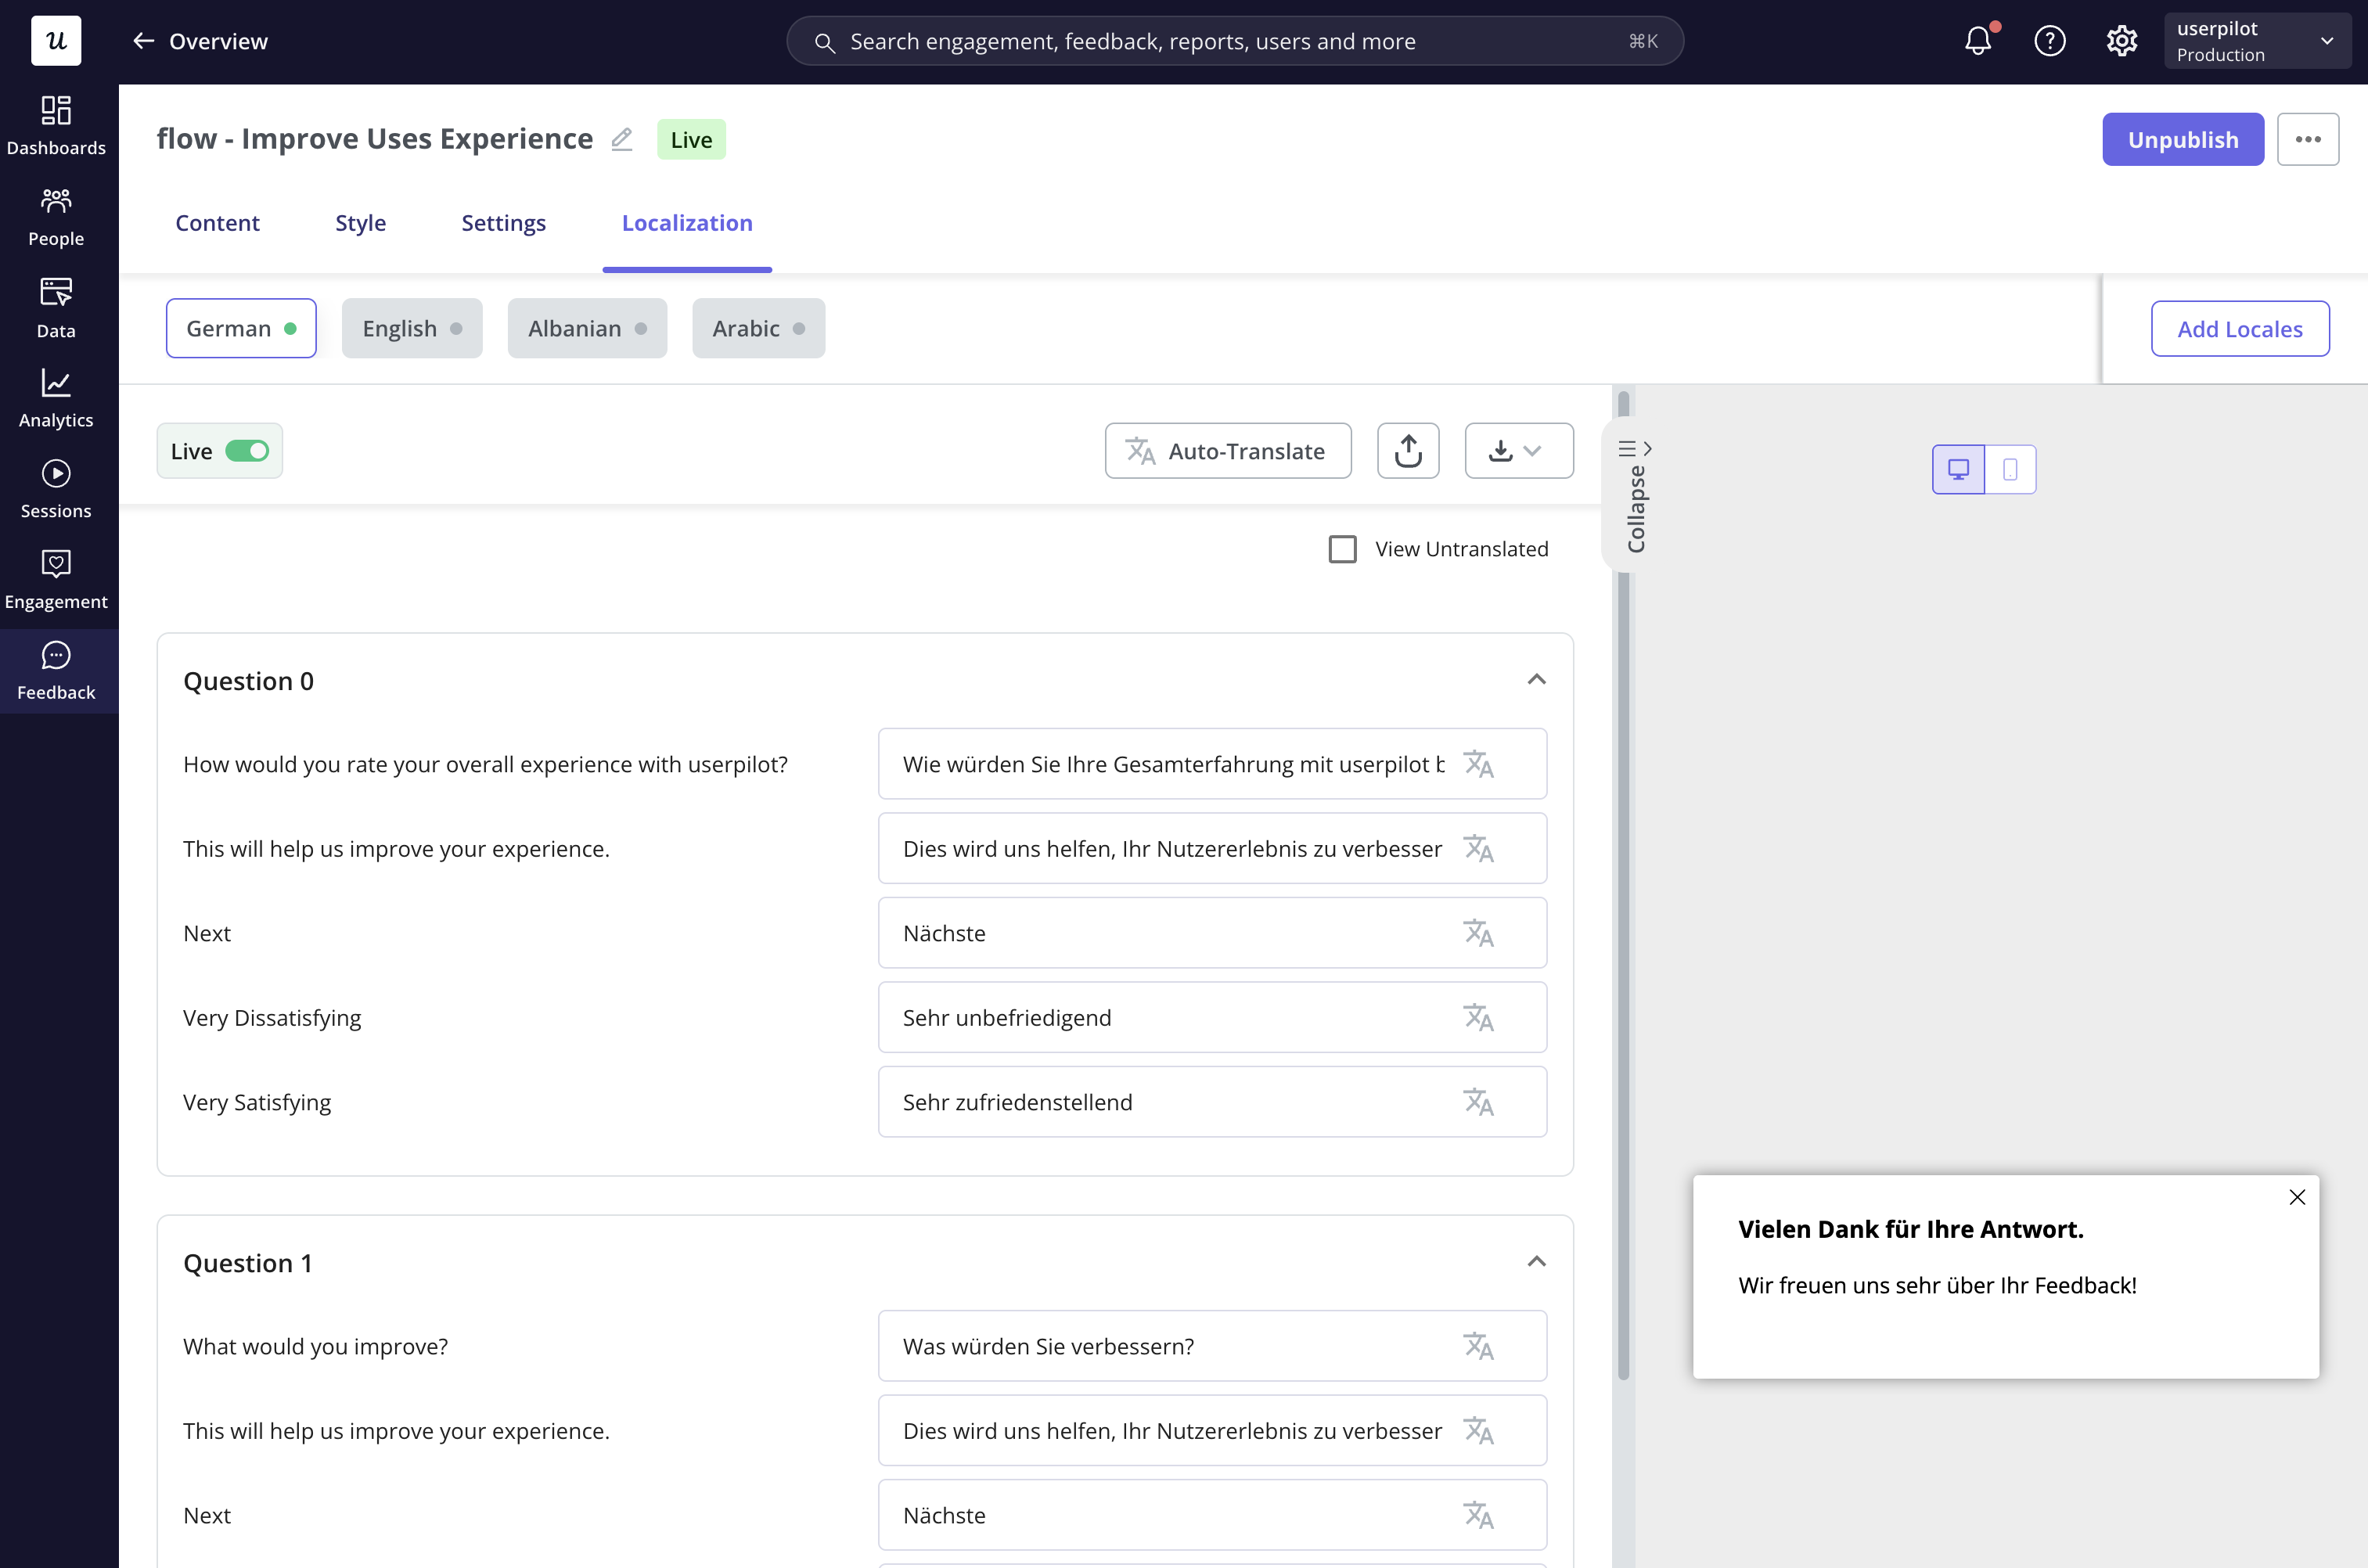
- Localization
To create a new survey, follow these steps: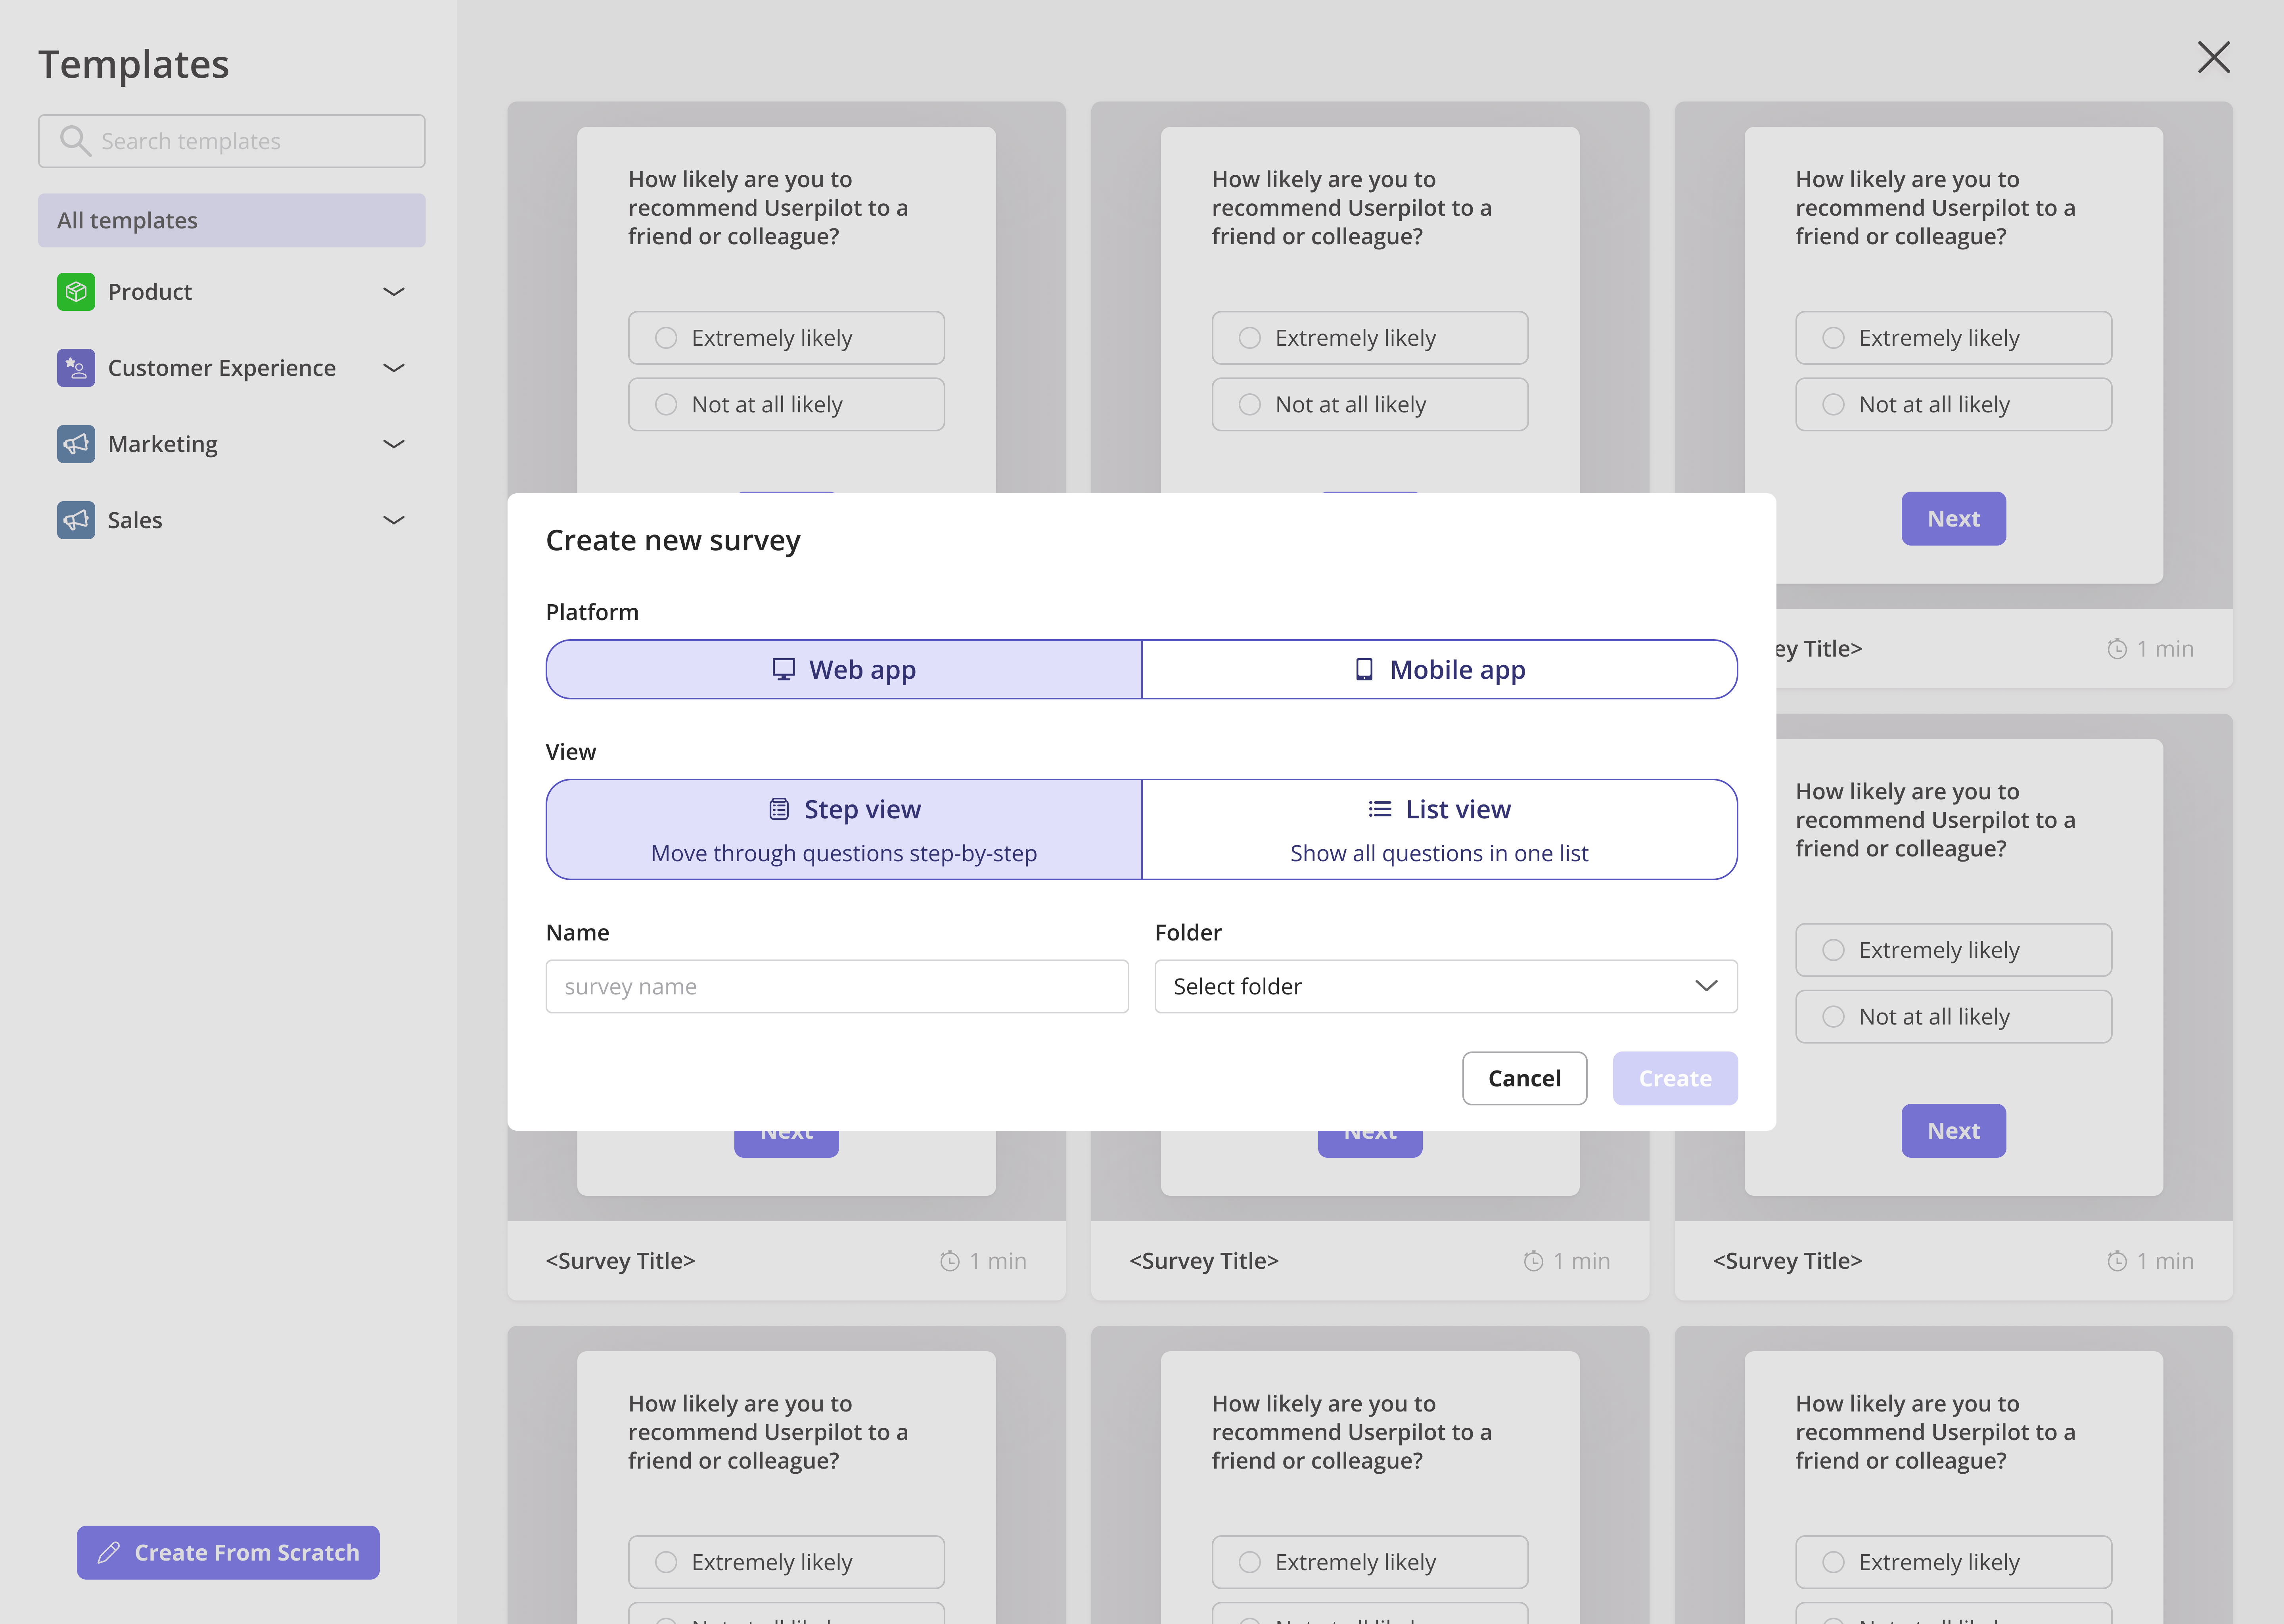
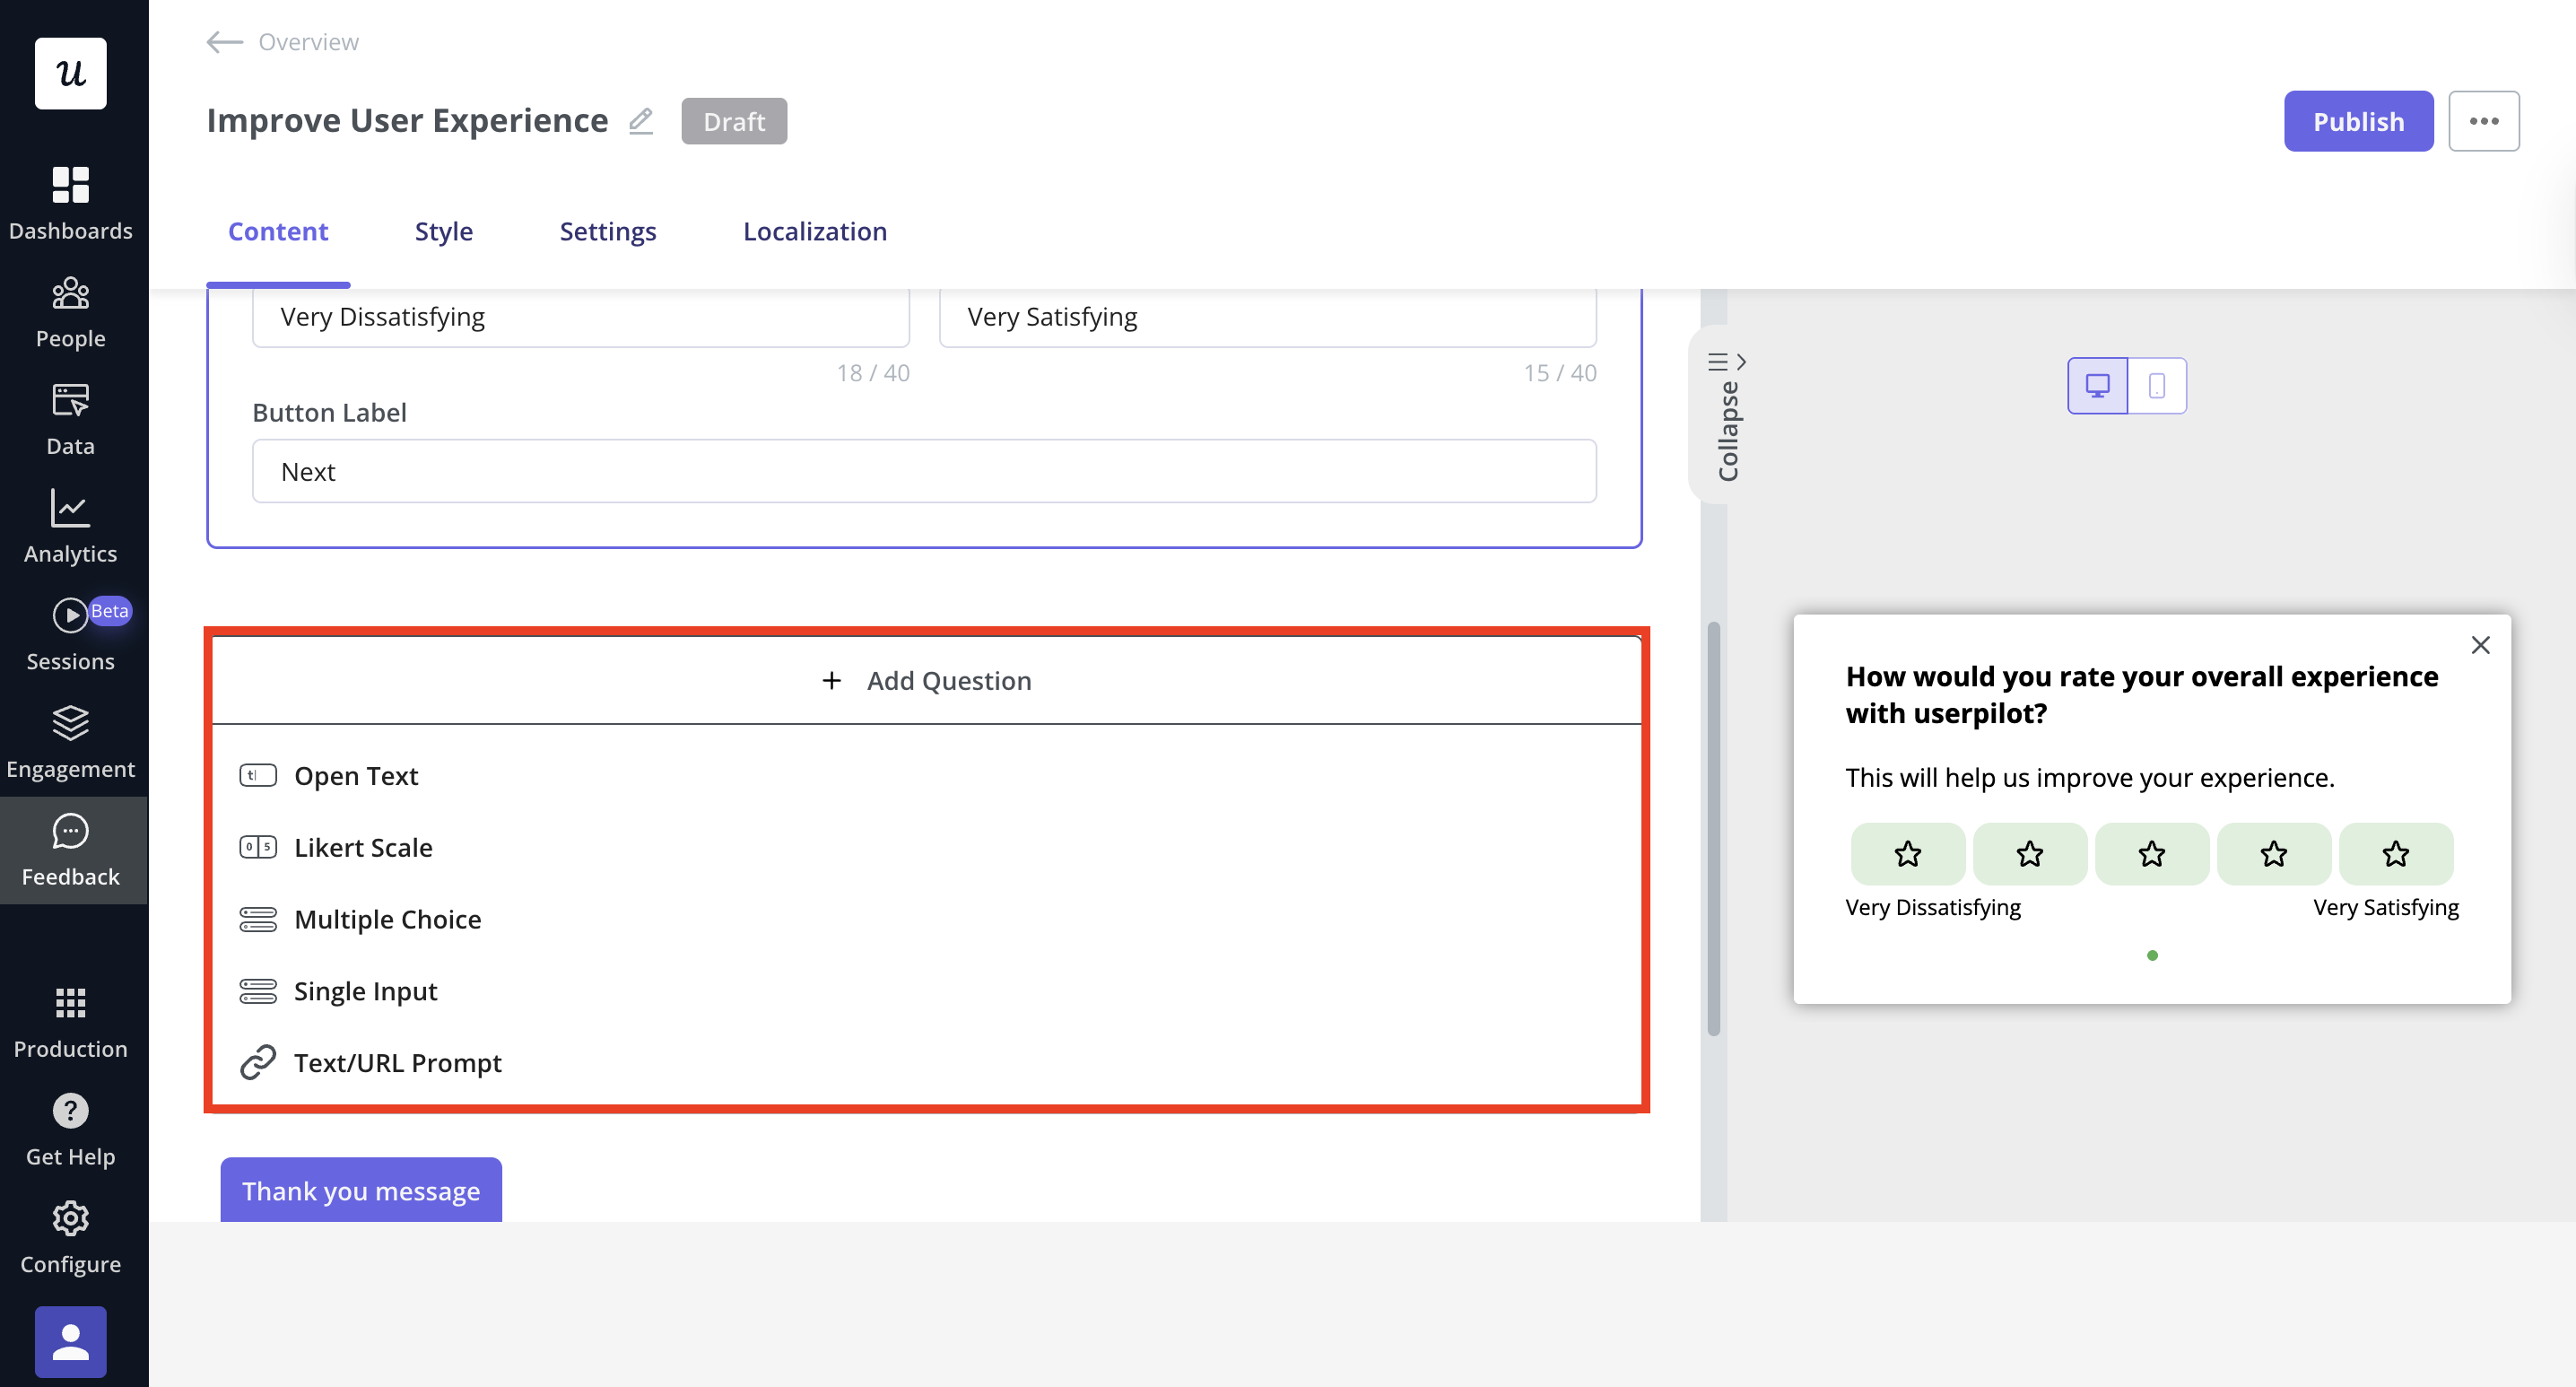
To add questions, click + Add Question and choose from types to tailor the survey based on responses.
Survey logic lets you show or skip questions depending on how users answer, keeping the experience simple and helping you collect more accurate, meaningful feedback.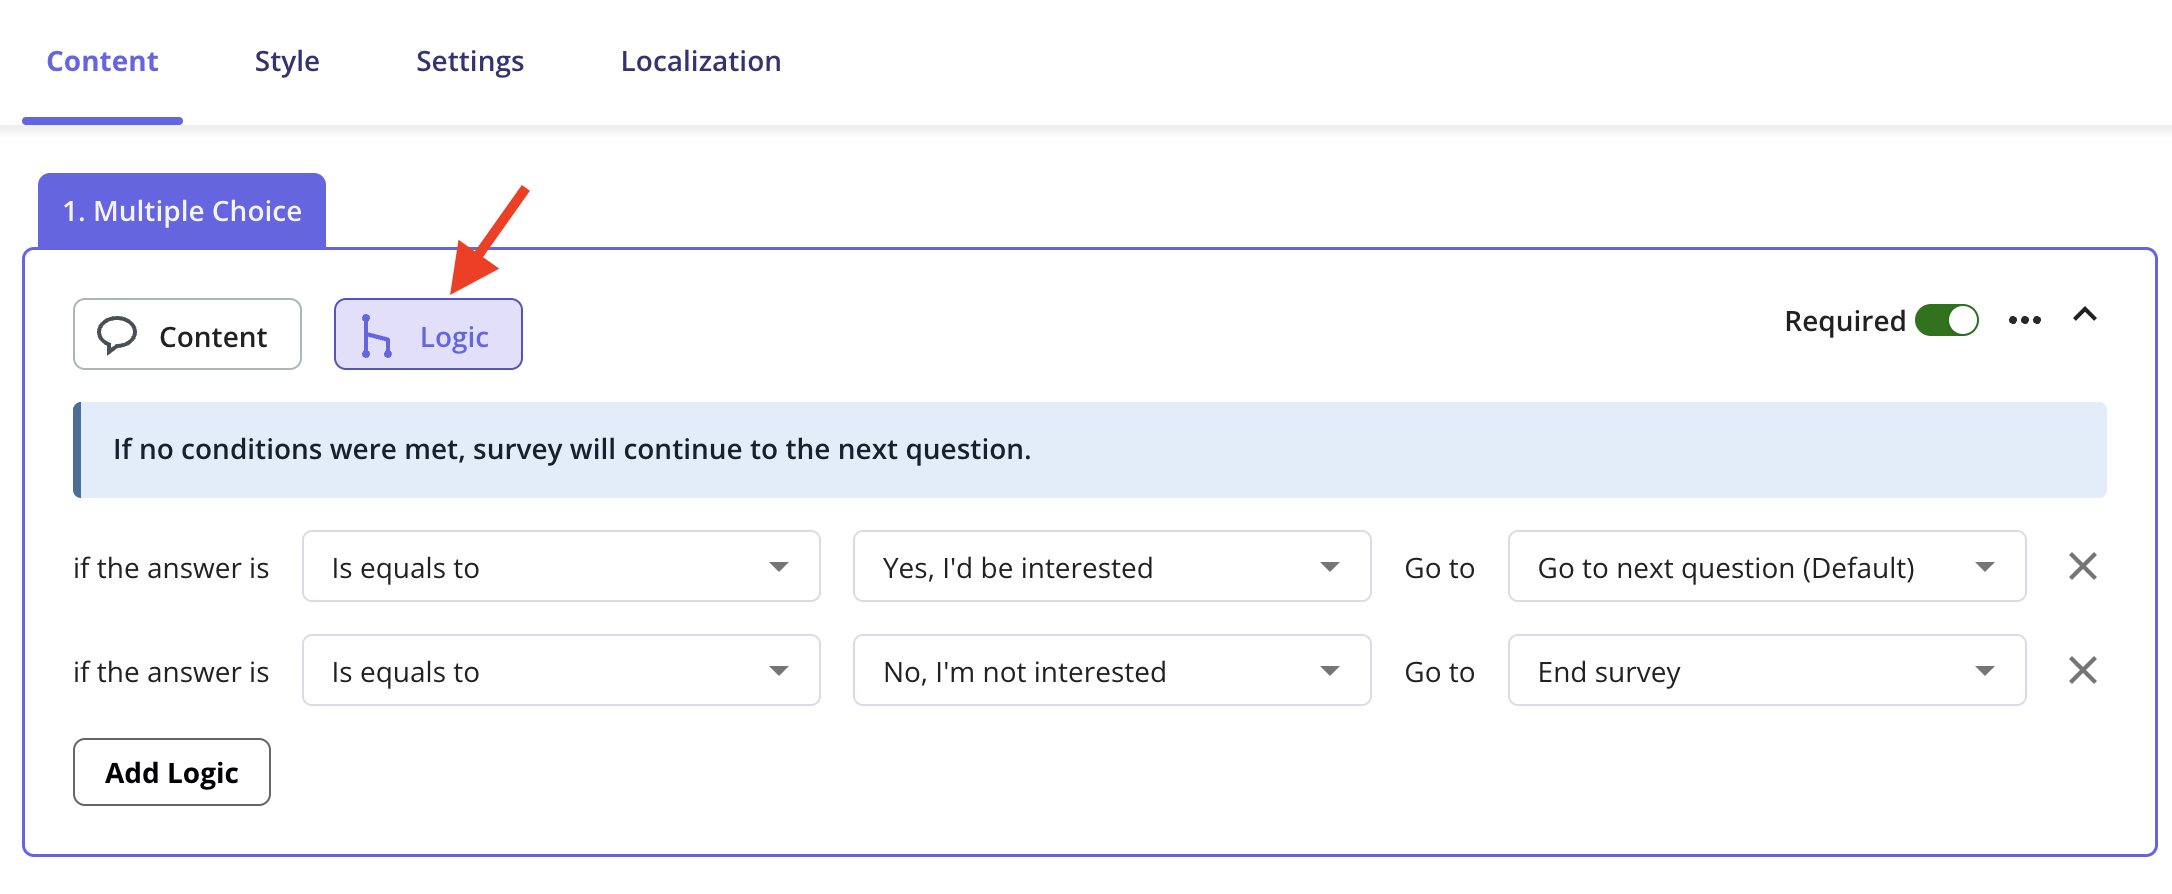
- **Navigate to the Survey Page. **From the navbar, click User Feedback > Survey and then Create Survey.
- Choose a template or create one from scratch. Templates include:
- Product: Gather product feedback, evaluate fit.
- Customer Experience: Measure CSAT, CES.
- Marketing: Collect insights from new users, track attribution.
- Sales: Qualify leads, understand customer choices.
- **Select the platform, and then **pick either Web app or Mobile app based on where you want to gather user feedback.
If you want feedback from both your web app and mobile app users, you’ll just need to set up two separate surveys, one for each platform.
Survey Questions
Userpilot offers multiple question types to fit your survey needs.To add questions, click + Add Question and choose from types to tailor the survey based on responses.
- Open-ended questions: Open text and single input - best for gathering detailed insights.
- Close-ended questions: Likert scale, multiple choice - best for quick, structured feedback.
-
Text/URL prompt: Use for directing users to content or capturing simple inputs.
Survey logic
For every survey question, you will see a Logic option. Once you open it, you can customize the question flow based on the user’s response.Survey logic lets you show or skip questions depending on how users answer, keeping the experience simple and helping you collect more accurate, meaningful feedback.
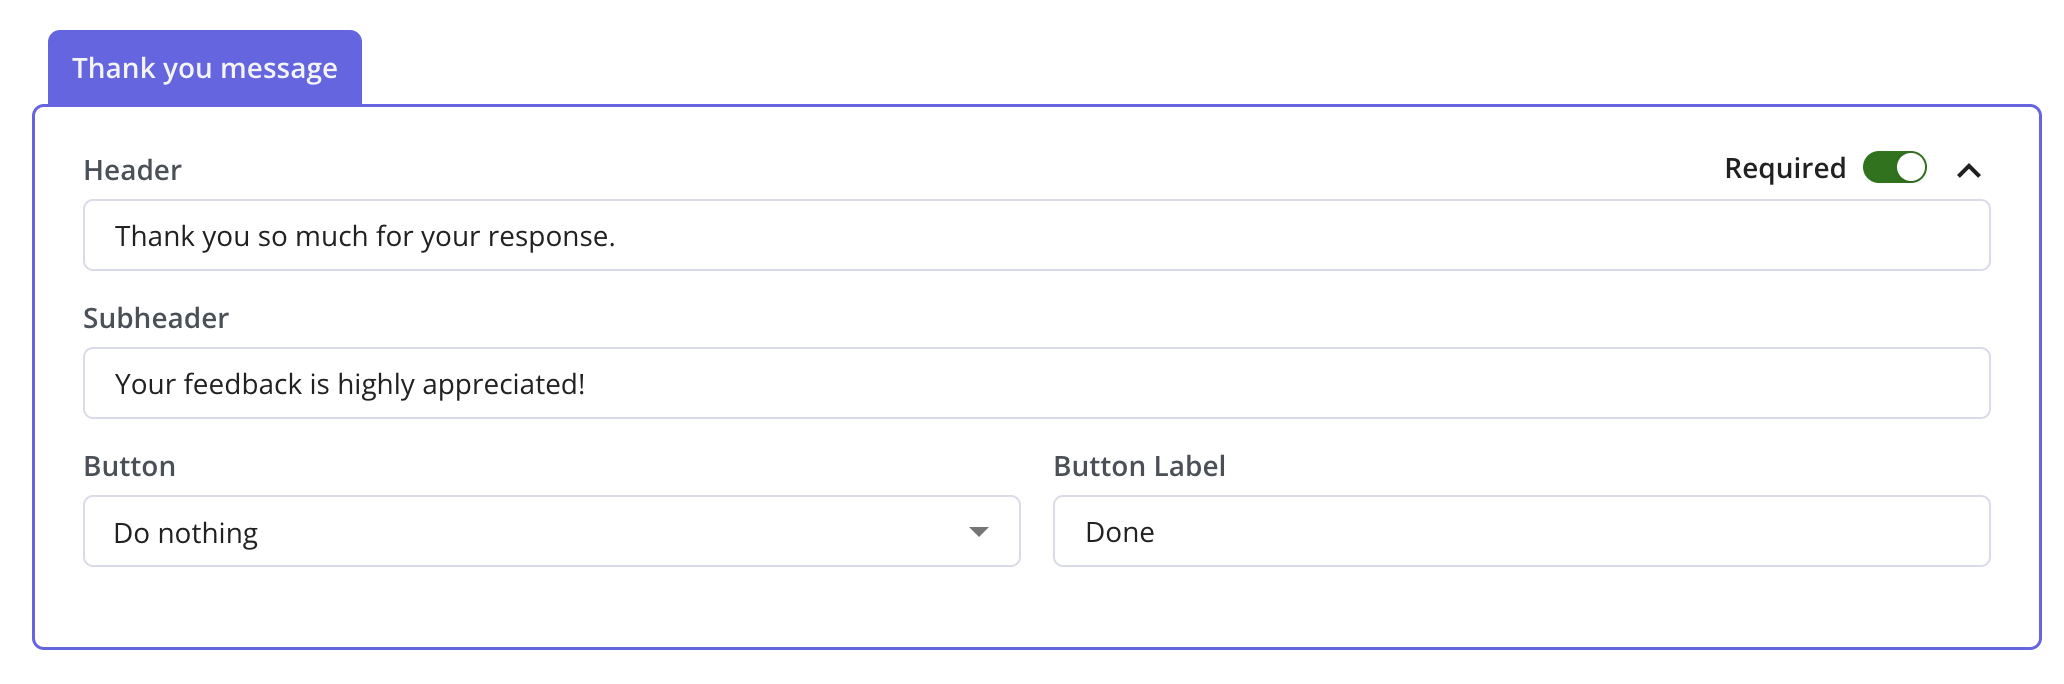
Thank you message
After you finish creating your survey questions, you can enable the Thank You message to acknowledge your users and thank them for taking the time to respond.You can make a question required by switching on the “Required” toggle.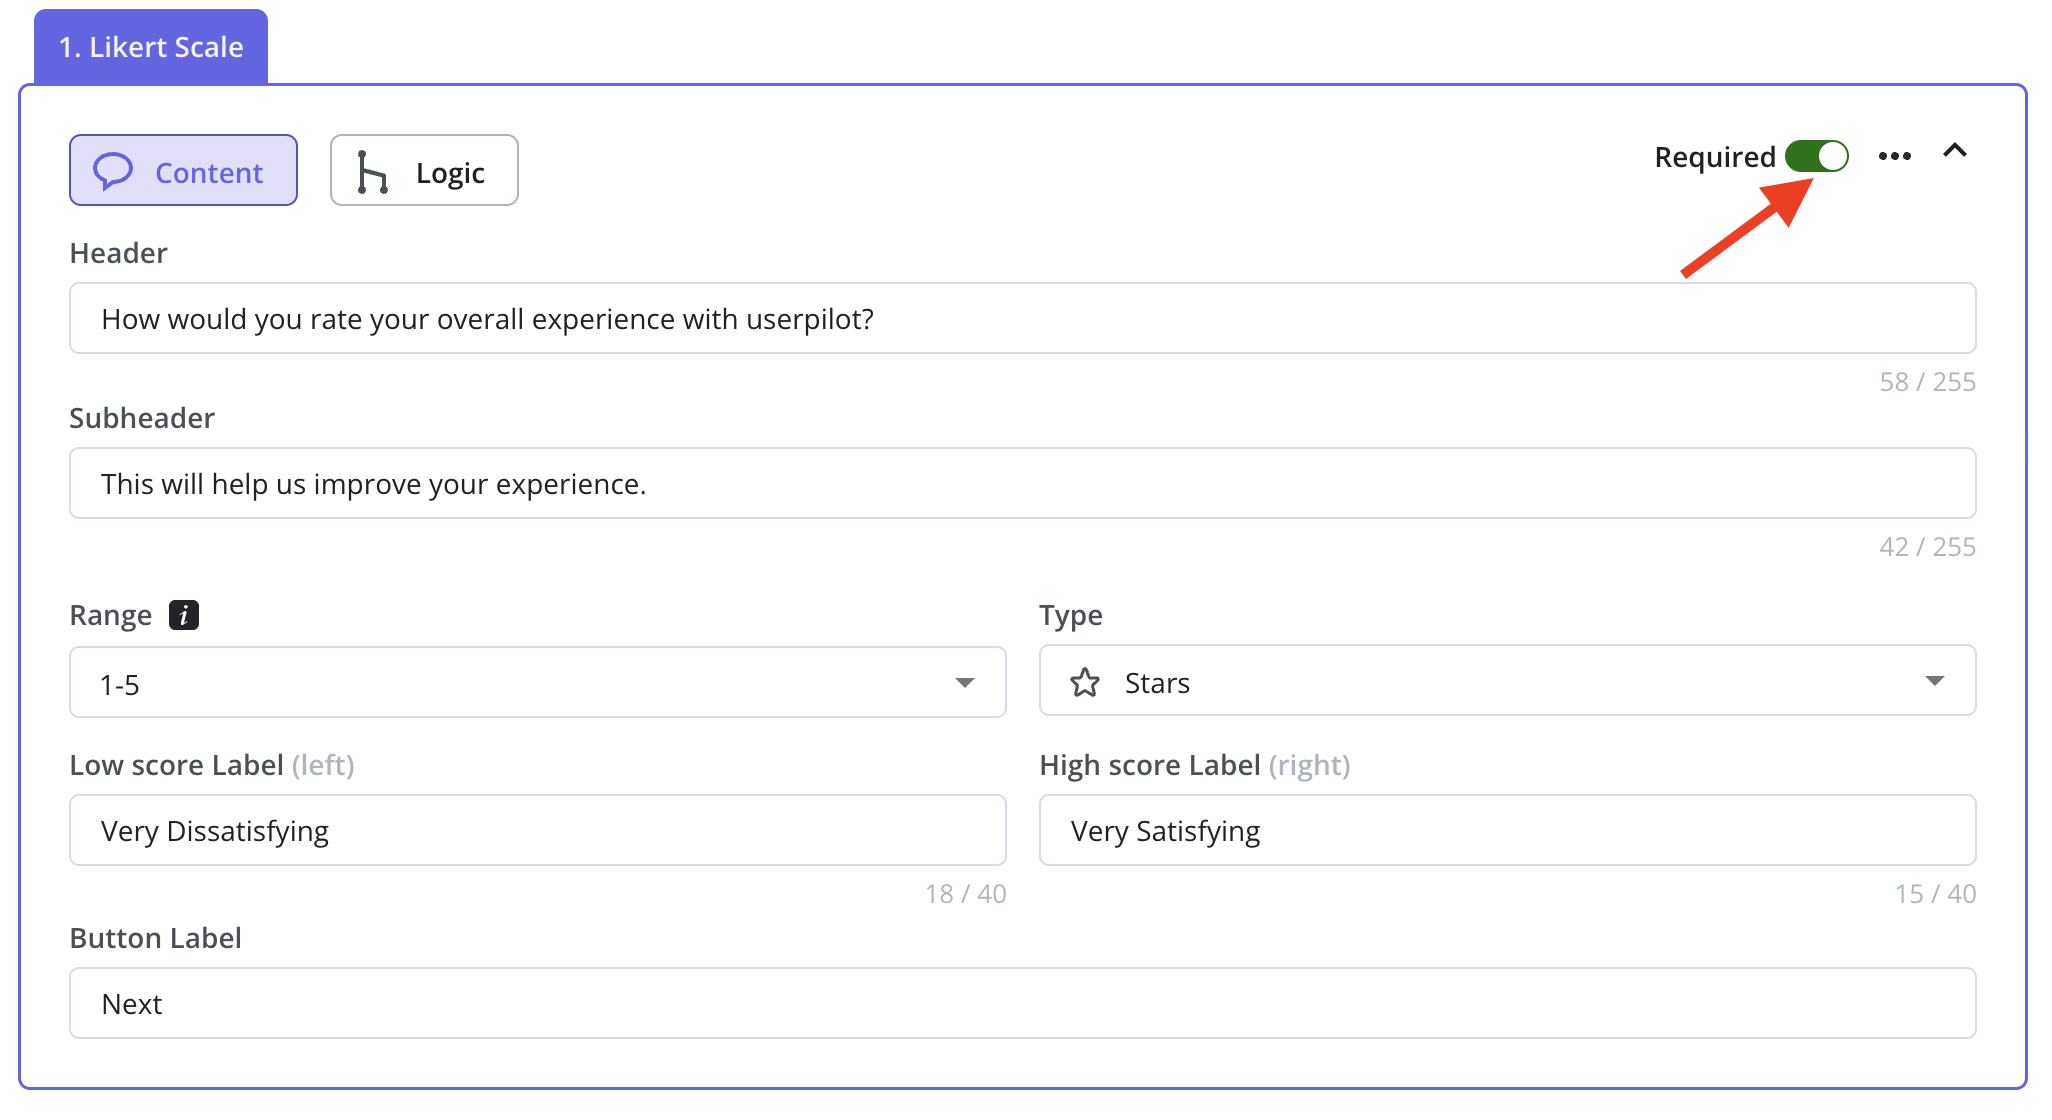

FAQs
What's the difference between a green dot and a yellow dot in the Localization tab?
What's the difference between a green dot and a yellow dot in the Localization tab?
- A green dot means the translated survey is live and fully active for end users.
- A yellow dot means the translation is saved but not yet live, requiring publishing to take effect.
How does the sampling rate affect survey triggering?
How does the sampling rate affect survey triggering?
The sampling rate determines what percentage of eligible users see the survey.
- Low sampling rate (e.g., 10%) → Only a small fraction of users receive the survey, reducing responses but avoiding survey fatigue.
- High sampling rate (e.g., 100%) → Every eligible user sees the survey, maximizing responses but increasing exposure.
If I update the original survey, will translations update automatically?
If I update the original survey, will translations update automatically?
No, translations do not auto-update when the original survey content changes. You must manually retranslate or update each language version.
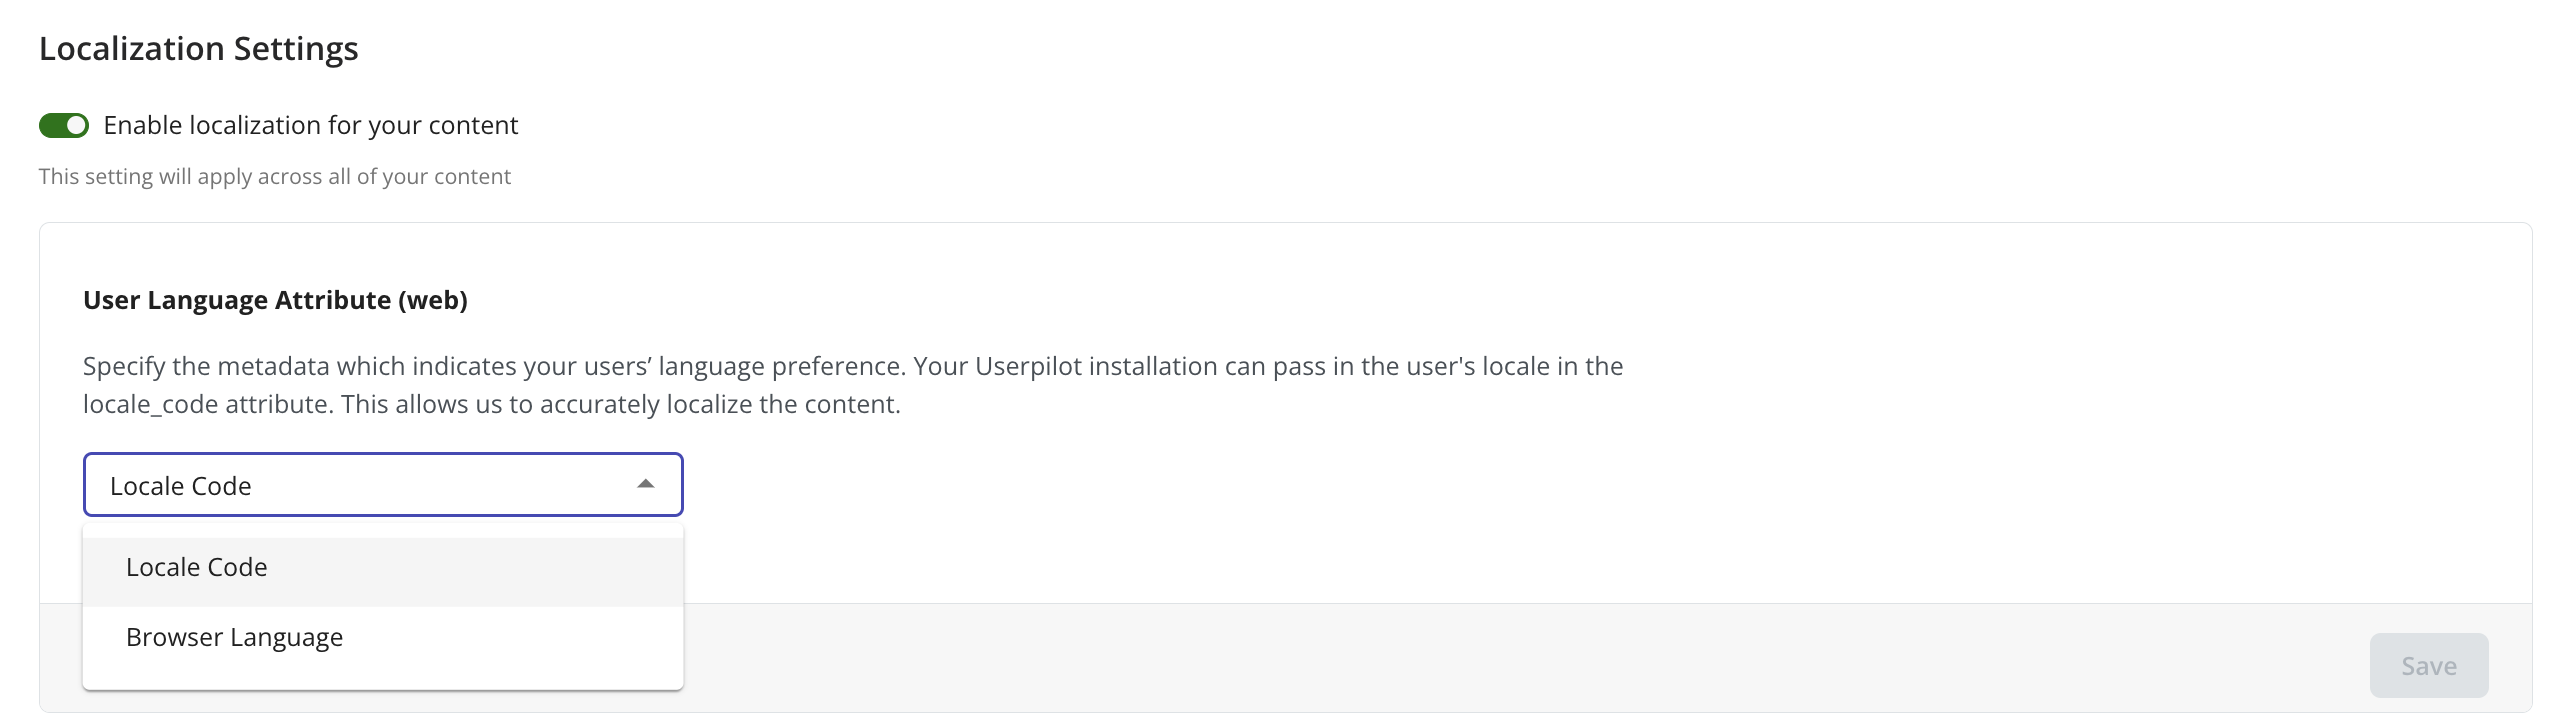
What happens if a user's language isn't available in my localization settings?
What happens if a user's language isn't available in my localization settings?
If a user’s language isn’t translated, they will see the default base language of the survey.