Overview
This article explains how the Userpilot SDK tracks and logs events related to flows within the Analytics tab. It covers the logic behind each event type, what they represent, and how this data helps you evaluate user engagement, identify drop-offs, and measure the overall effectiveness of your flows. The SDK records key events at both the flow and step levels, offering detailed insights into how users interact with your in-app experiences.The goal of tracking these events
- Identifying how users interact with multi-step experiences
- Measuring completion rates and friction points
- Enabling targeted improvements to onboarding, adoption, and engagement flows
Key Metrics and completion overview
Key metrics for the flow
- Total Shown: the number of unique users who received and saw the flow on their device.
- Completed: the number of users who completed the flow.
- Dismissed: the number of users who dismissed the flow.
- Average Time to Complete: the average time it took users to complete all the flow steps.
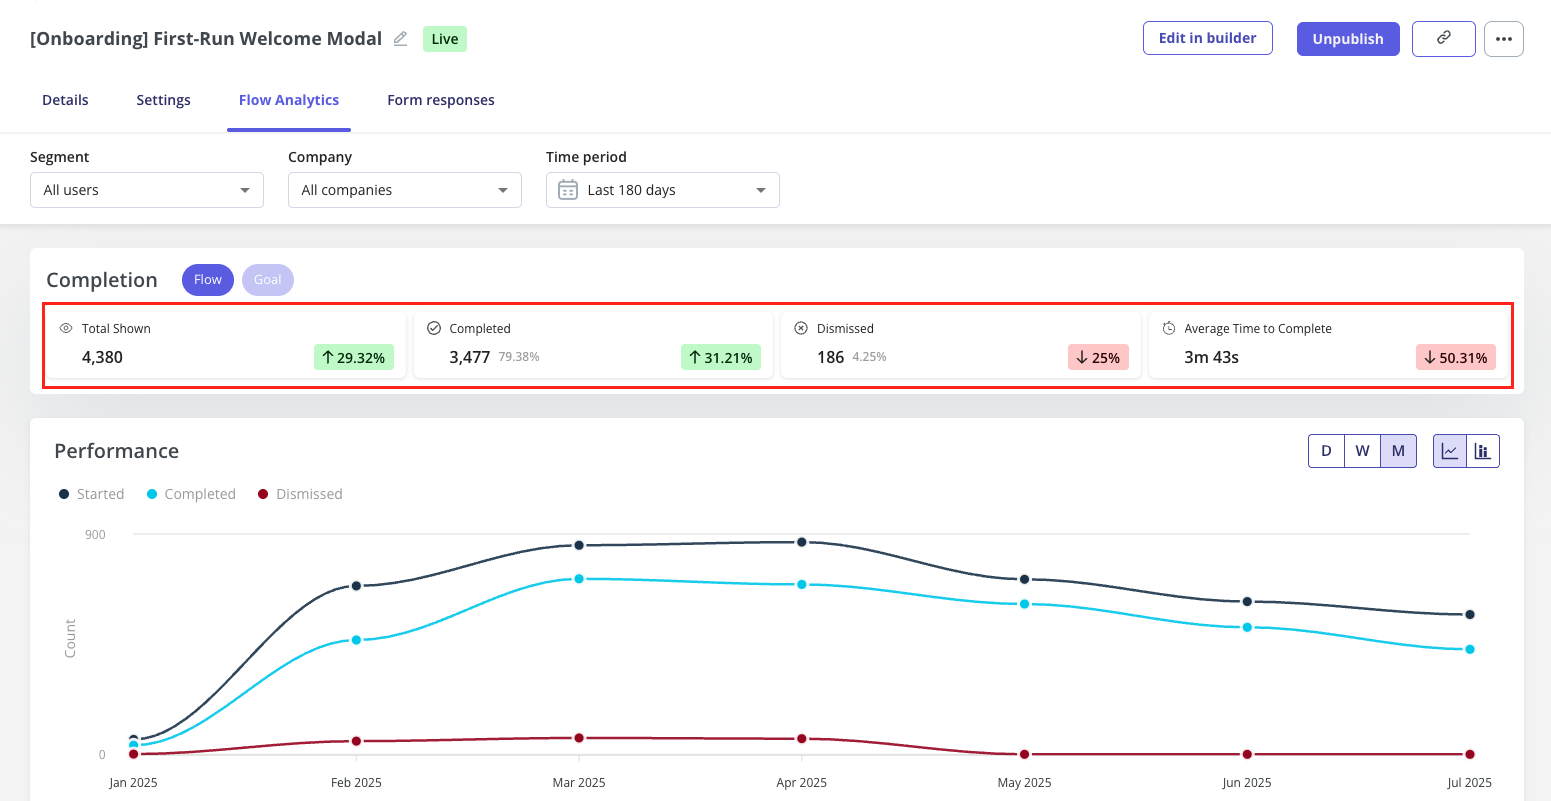
Each metric includes a visual indicator (green or red arrow) showing the percentage change compared to the previous period (e.g., +3% from the last 7 days).
SDK rules
This section breaks down the logic the SDK follows to track each flow event shown in the Analytics tab:Total shown
Trigger conditions- User views at least one step of the flow (even without interaction)
- User reaches the final step (counted as complete even without interaction)
Completed
Trigger conditions- User completes all the flow steps
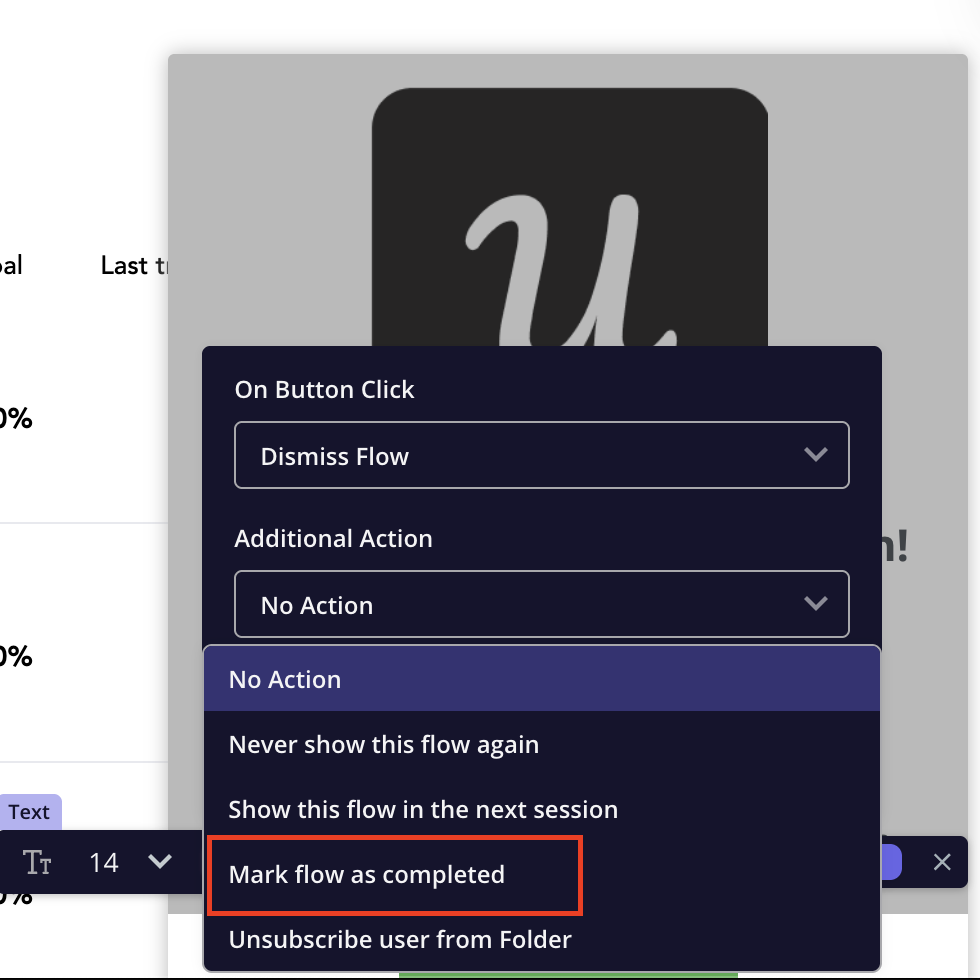
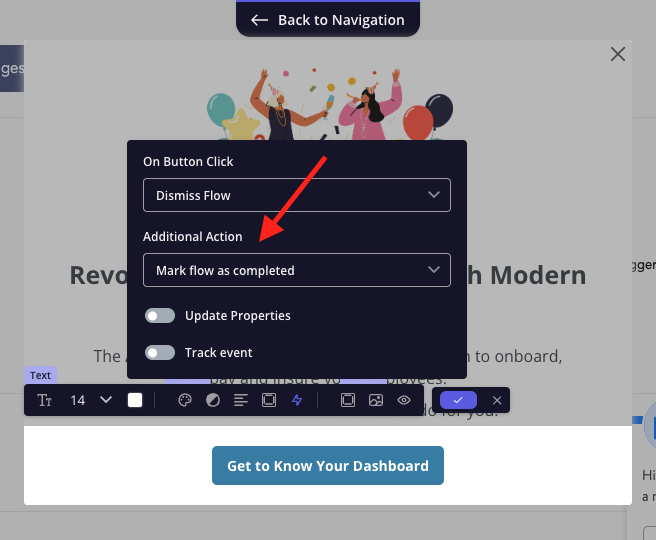
- User interacts with a button that executes the “Mark flow as completed” action
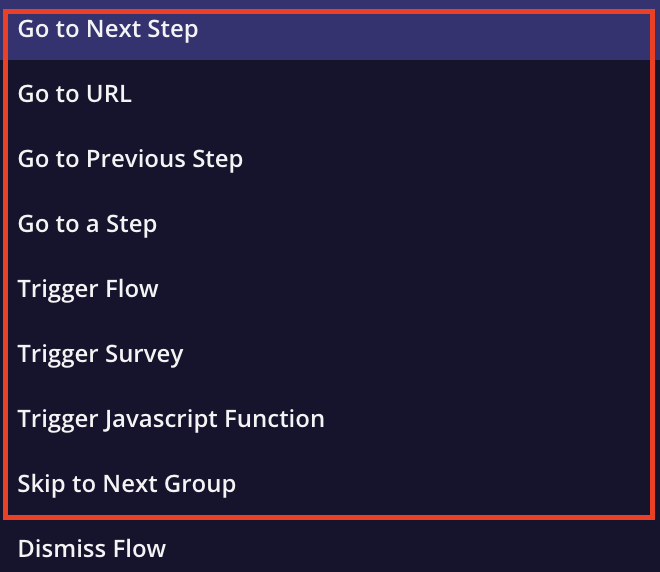
- User clicks on the button that contains any action except dismiss
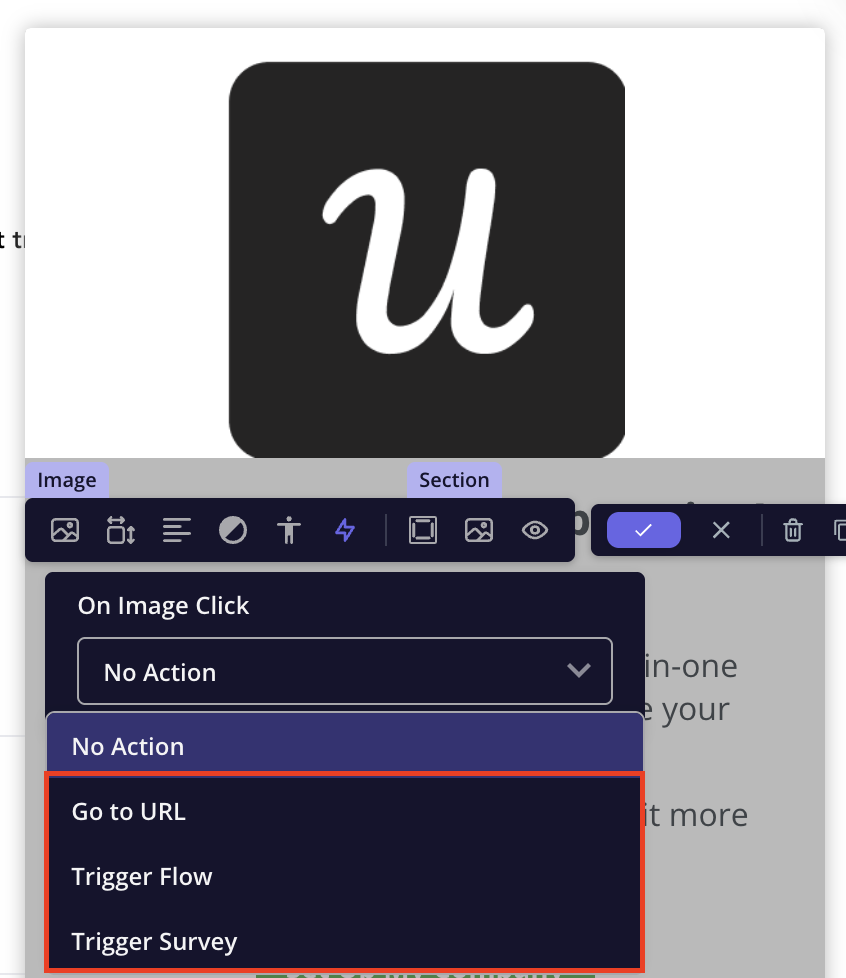
- User clicks on the image that contains any action, as shown in the screenshot below
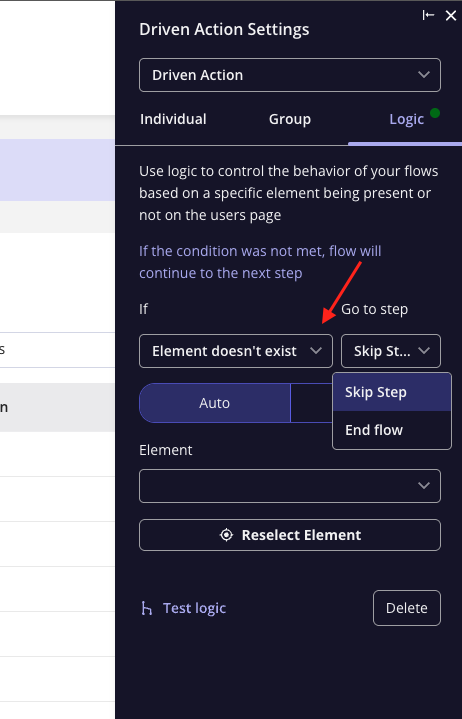
- If the flow step contains logic that references a step that doesn’t exist, the SDK should skip that step and mark the flow/step as completed.
Dismissed
- Click a CTA with a dismiss action (e.g., Dismiss and never show again)
- Press the ESC key
NoteYou might notice that Dismiss and Complete events sometimes add up to more than the total Show count. This usually happens based on how users interact with the last step of the flow.For example, if a user reaches the final step and clicks the dismiss icon, Userpilot will log both a Complete and a Dismiss event for that user.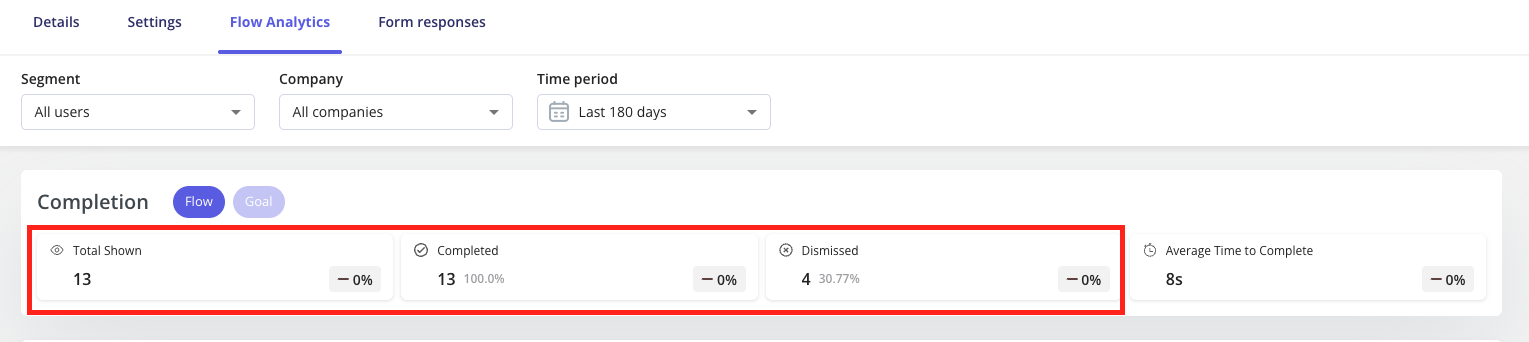
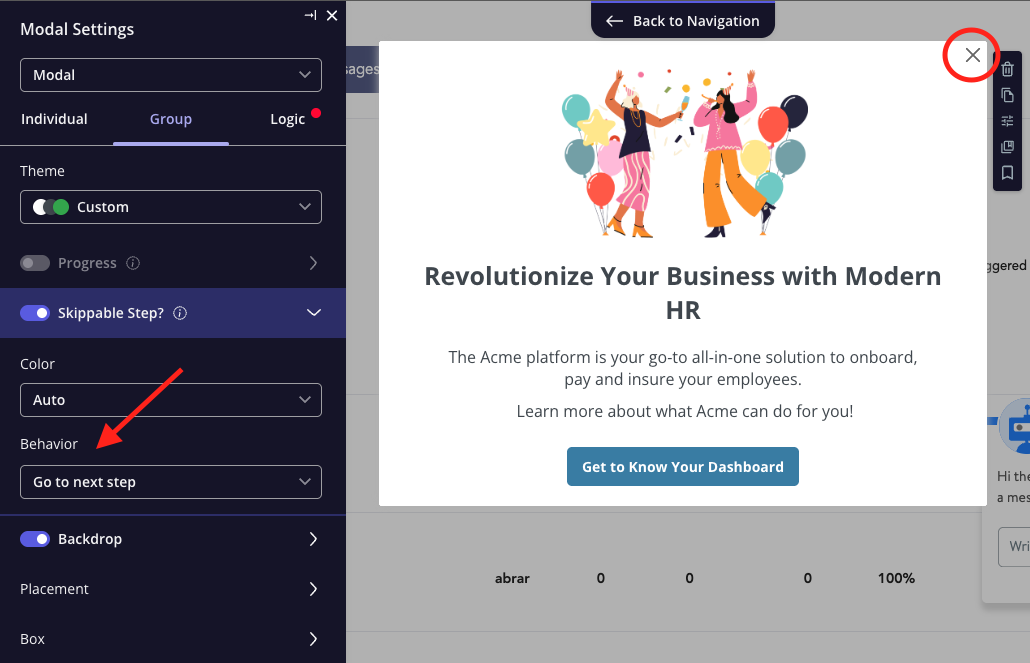
- Set the button action to “Dismiss and mark flow as completed”, or any other action
- Set the dismiss icon action to “Go to next step”
If a user navigates away from the flow, like refreshing the page, closing the tab, etc… (doesn’t dismiss it), the user would only be considered as seen; no dismiss or complete event would be registered.
Filters and segmentation
You can filter the data by:- Segment - based on the defined user segments you created.
- Company - filter by specific company names you have.
- Time Period - choose your desired date range (e.g., Last 7 days) to view recent or historical trends
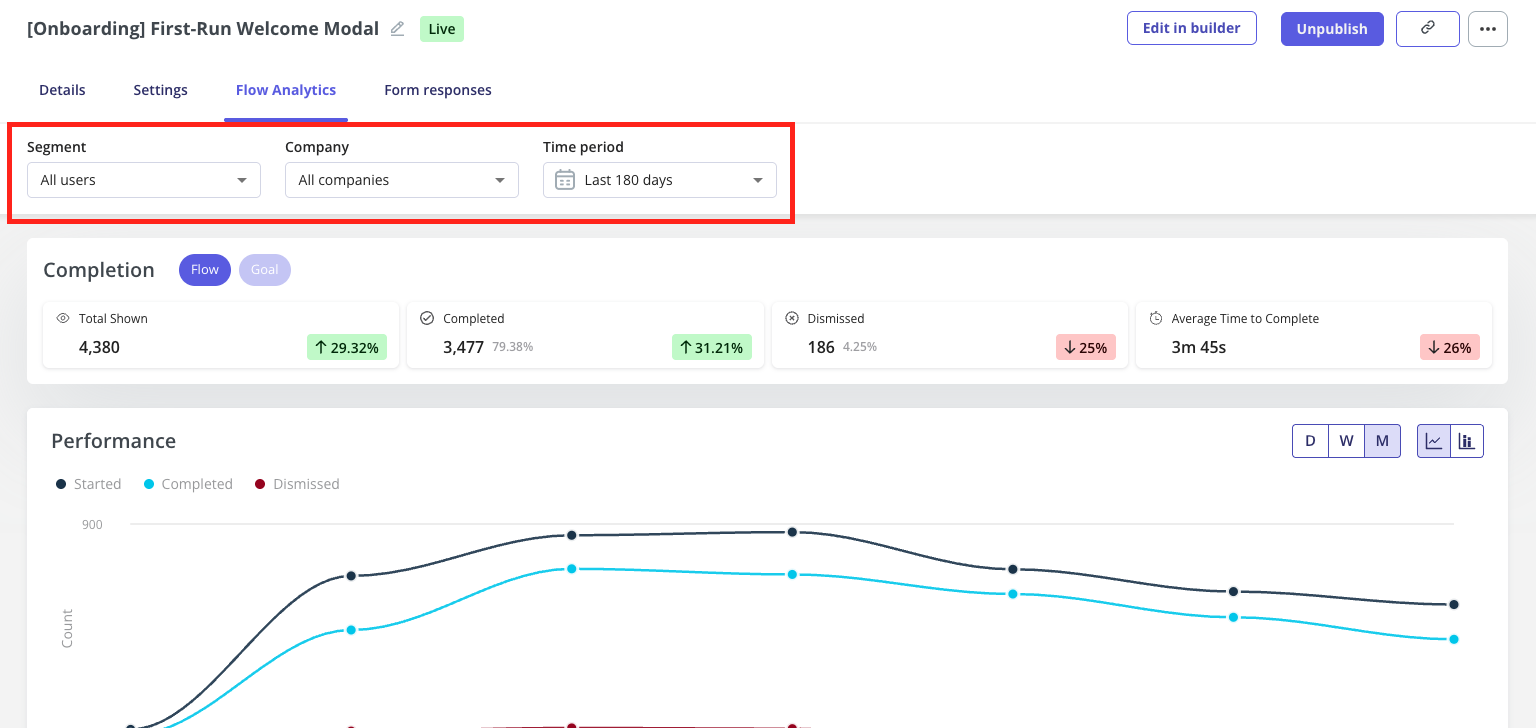
Performance trends
The Performance graph helps you visualize user interactions over time. It displays daily counts for: Started, Completed, and Dismissed. Each line on the chart represents a different metric. Hover over any point to see the exact data value for that date. You can switch between daily, weekly, and monthly views, compare results with the previous period to track performance trends, and change the chart type to a column view if you prefer.Steps Breakdown
This section shows how users interact with each step of your flow, especially helpful for multi-step flows. It helps you identify where users are most likely to drop off, so you can pinpoint steps that may need improvement or optimization.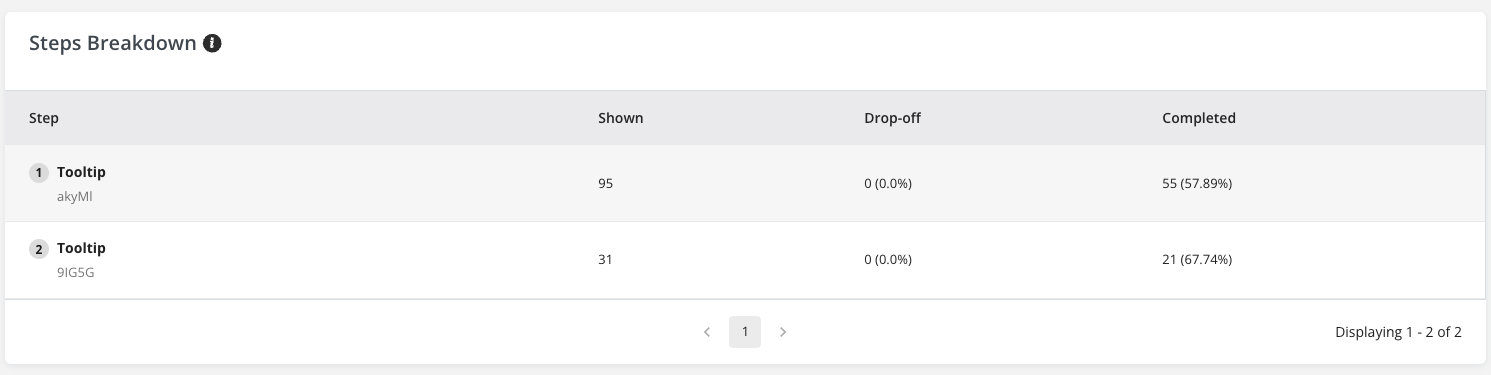
You can click on the Shown, Drop-off, or Completed count to view the list of users who performed that action.
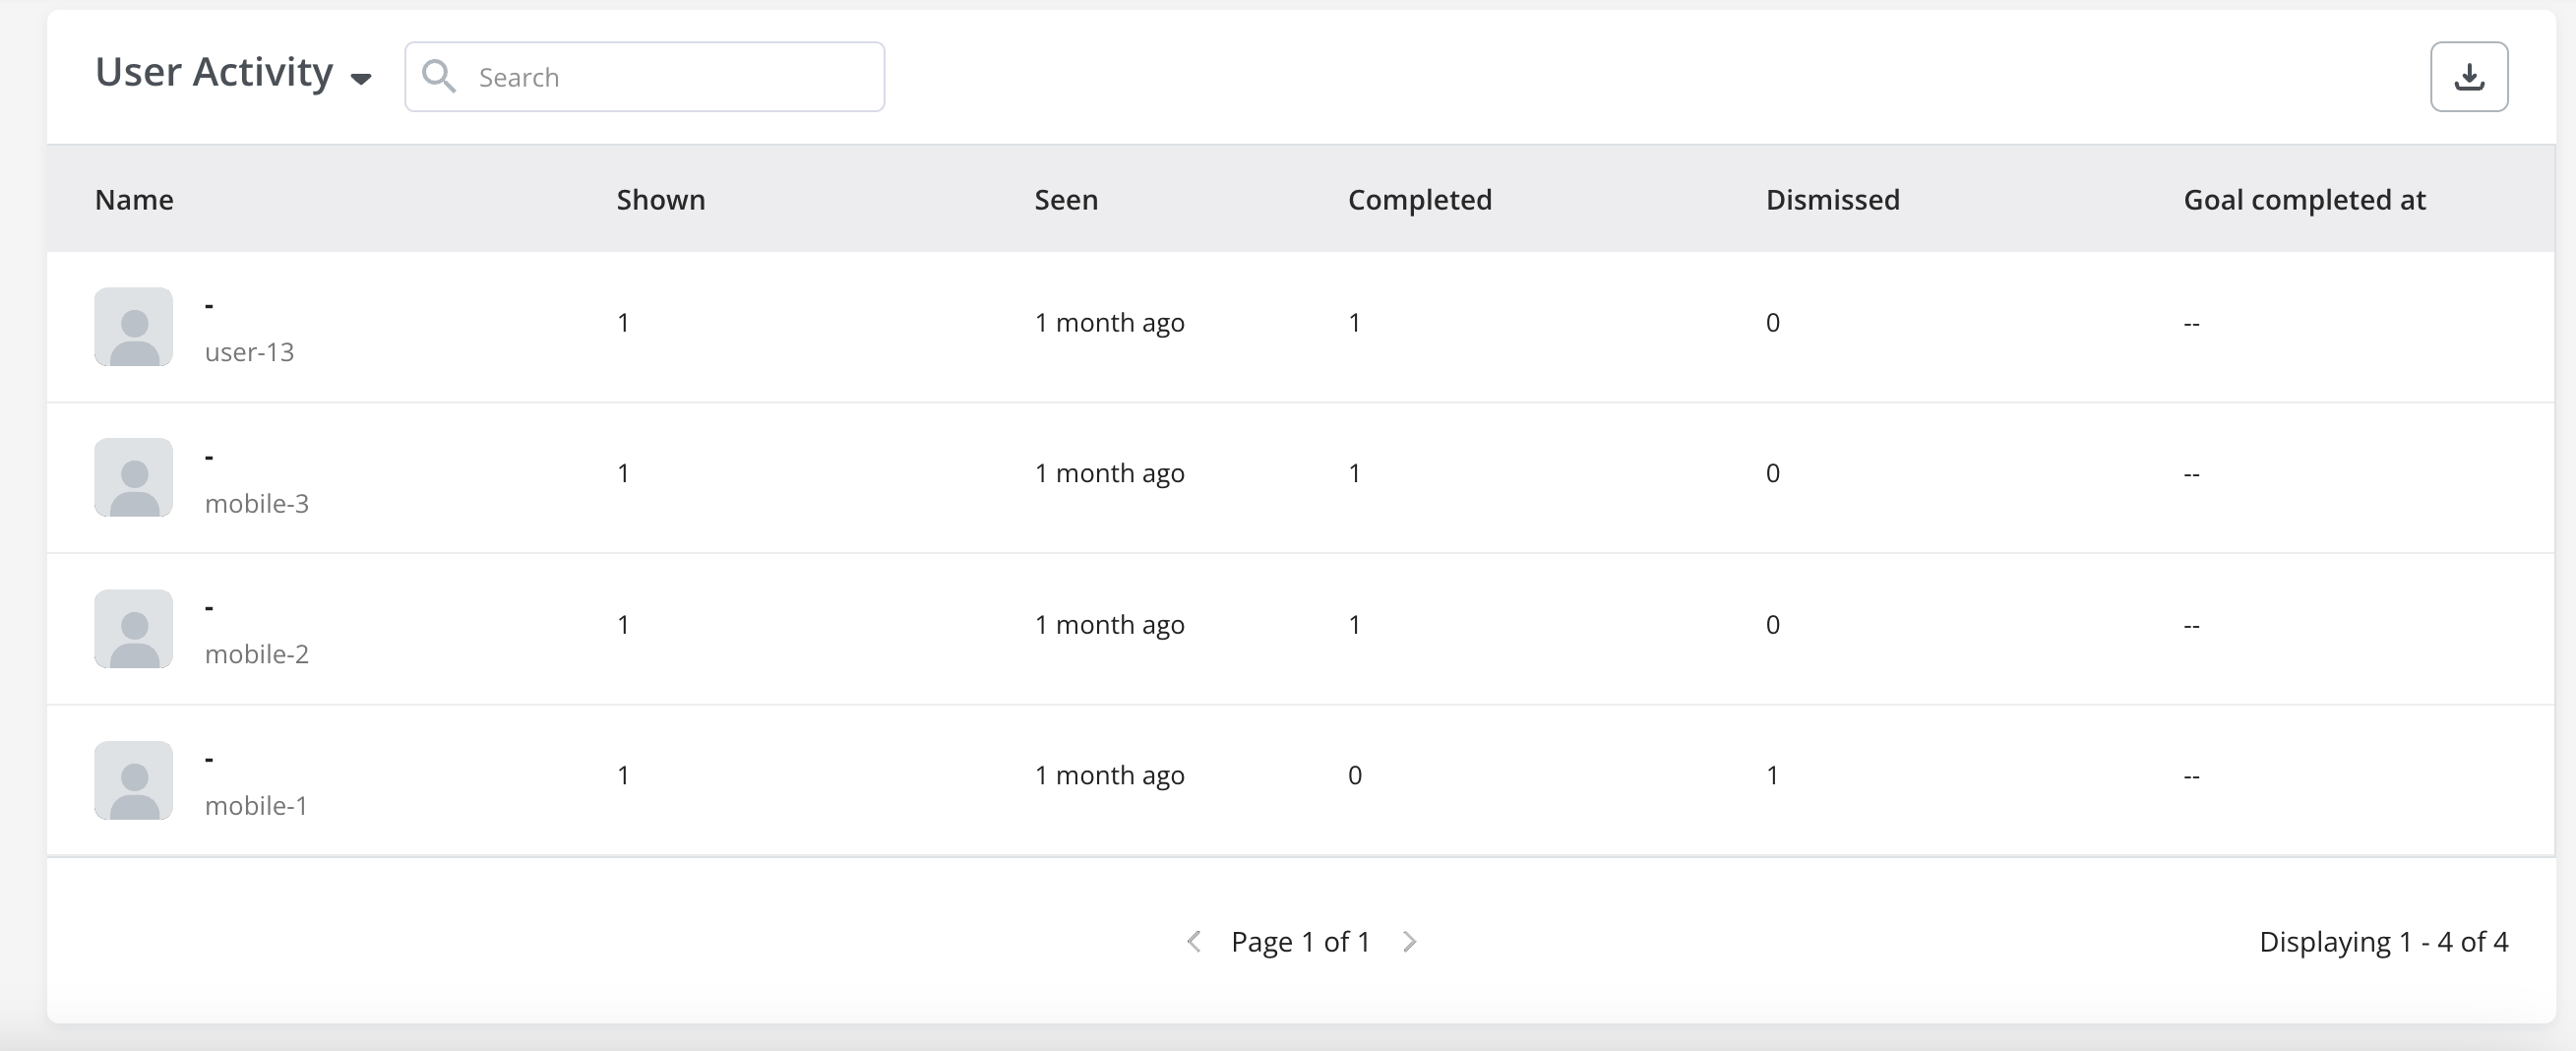
User/Company Activity table
Below the graph, the User/Company Activity section provides detailed breakdowns at the individual user/company level, including:- Name and ID: display the user/company name or identifier.
- Shown: the number of times the flow was delivered and displayed to the user/company.
- Seen: the timestamp or time period indicating when the user/company last saw the flow.
- Completed: indicates the number of times the user/company completed the flow.
- Dismissed: shows how many times the user/company dismissed the flow.
- Goal Completed at: the date and time when the user completed a defined goal after seeing the flow.
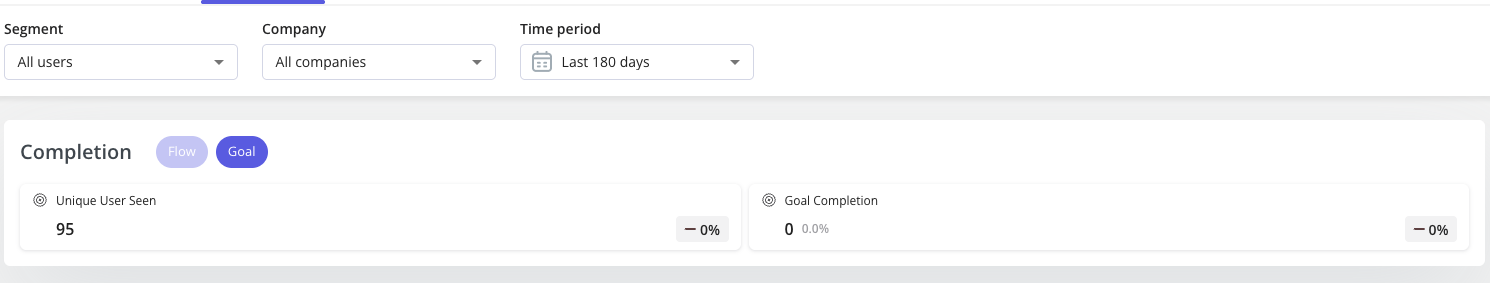
Goal tracking
If your flow includes a goal (e.g., “Perform an Action”), Userpilot also displays:- Unique Users Seen - the number of unique recipients the goal applied to.
- Goal Completion - the number of recipients who achieved the defined goal.
For any questions or concerns, please reach out to support@userpilot.com