User Activity Metrics
Shows the count of unique users who have actively used your product within the past day, week, and month.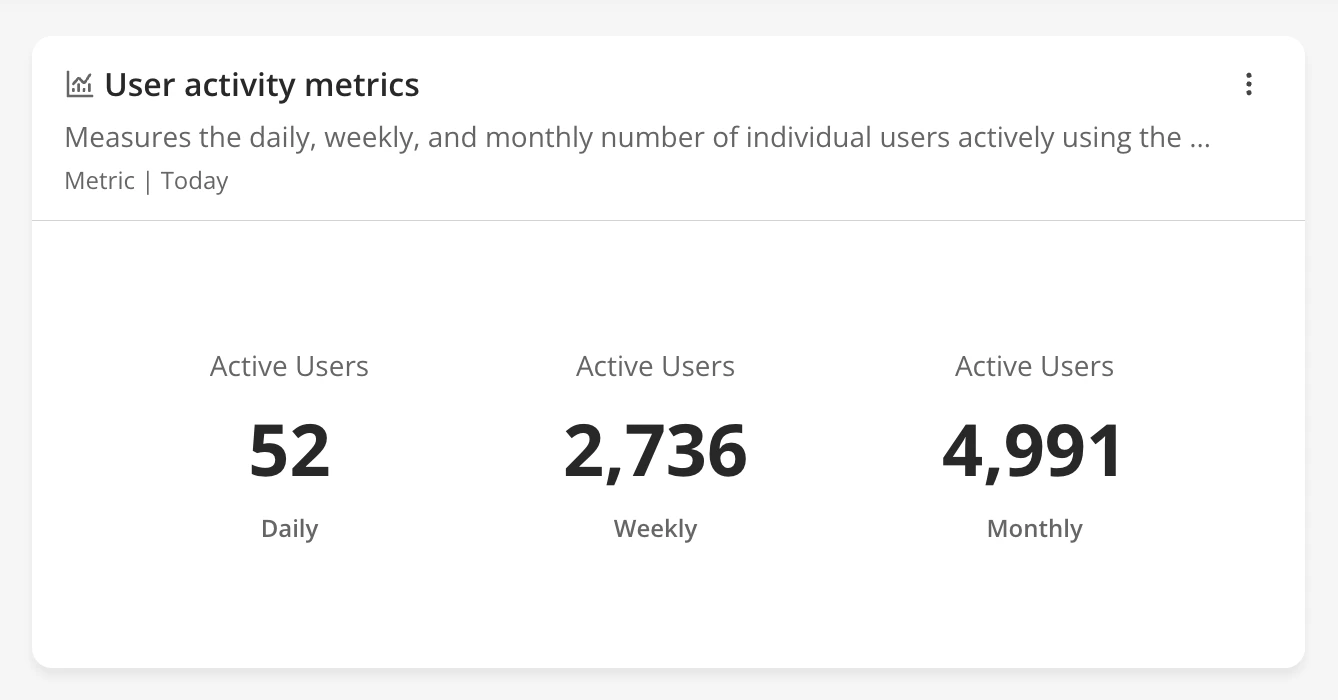
Company Activity Metrics
Shows the count of unique companies who have actively used your product within the past day, week, and month.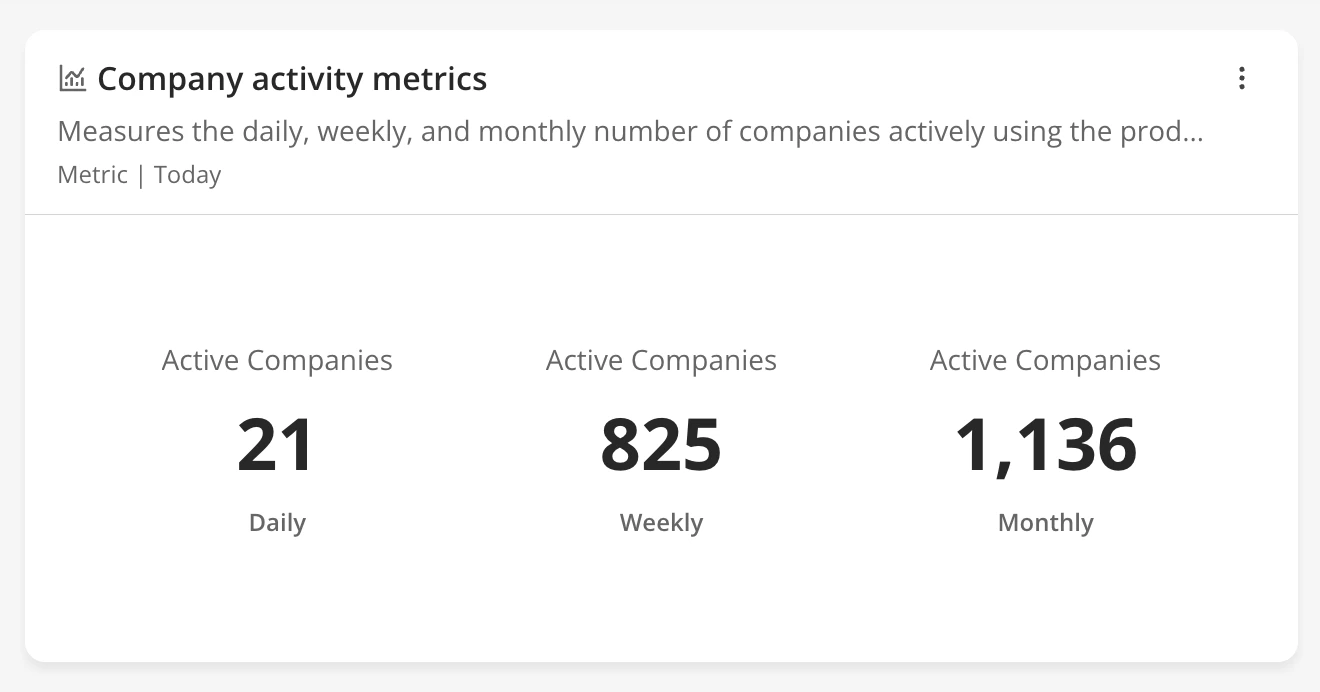
Trend of Active Users
A line chart which shows the trend of users who have actively used your product on a daily, weekly and monthly basis.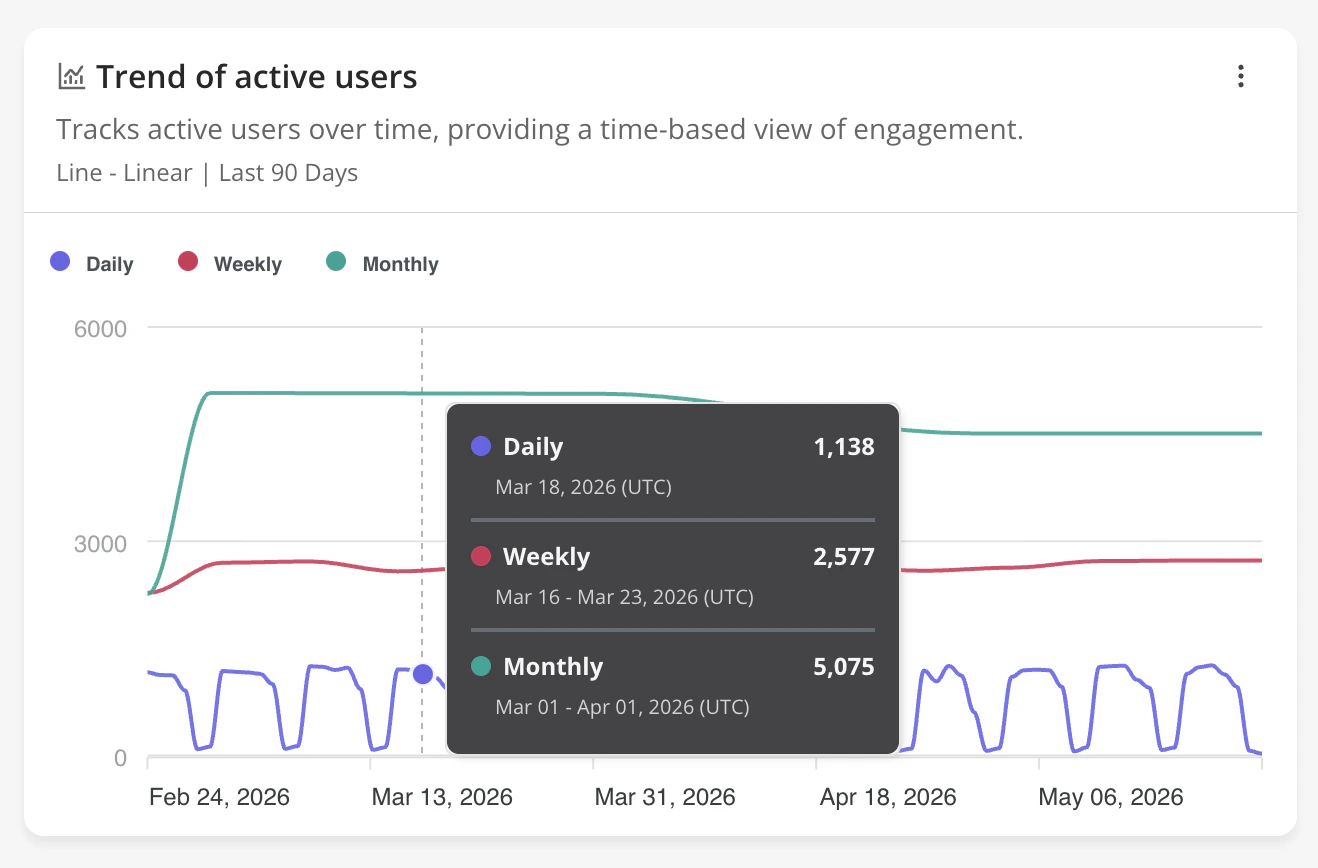
Trend of Active Companies
A line chart which shows the trend of companies who have actively used your product on a daily, weekly and monthly basis.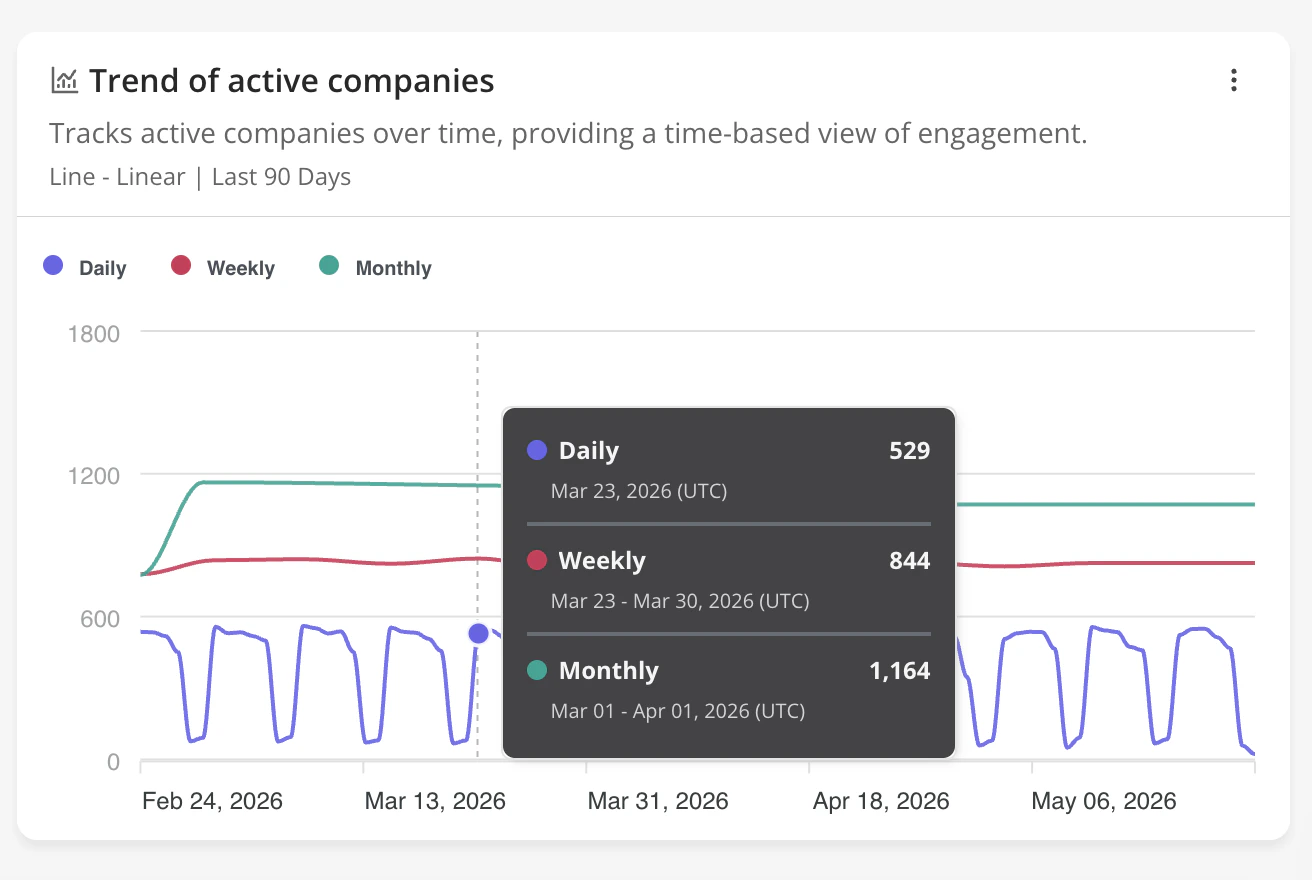
User Stickiness
The percentage of monthly active users who are are also daily active users (i.e. the percentage of active users over the past month who have been seen within the past day). It is an indicator of how “sticky” the product is, or how often users come back.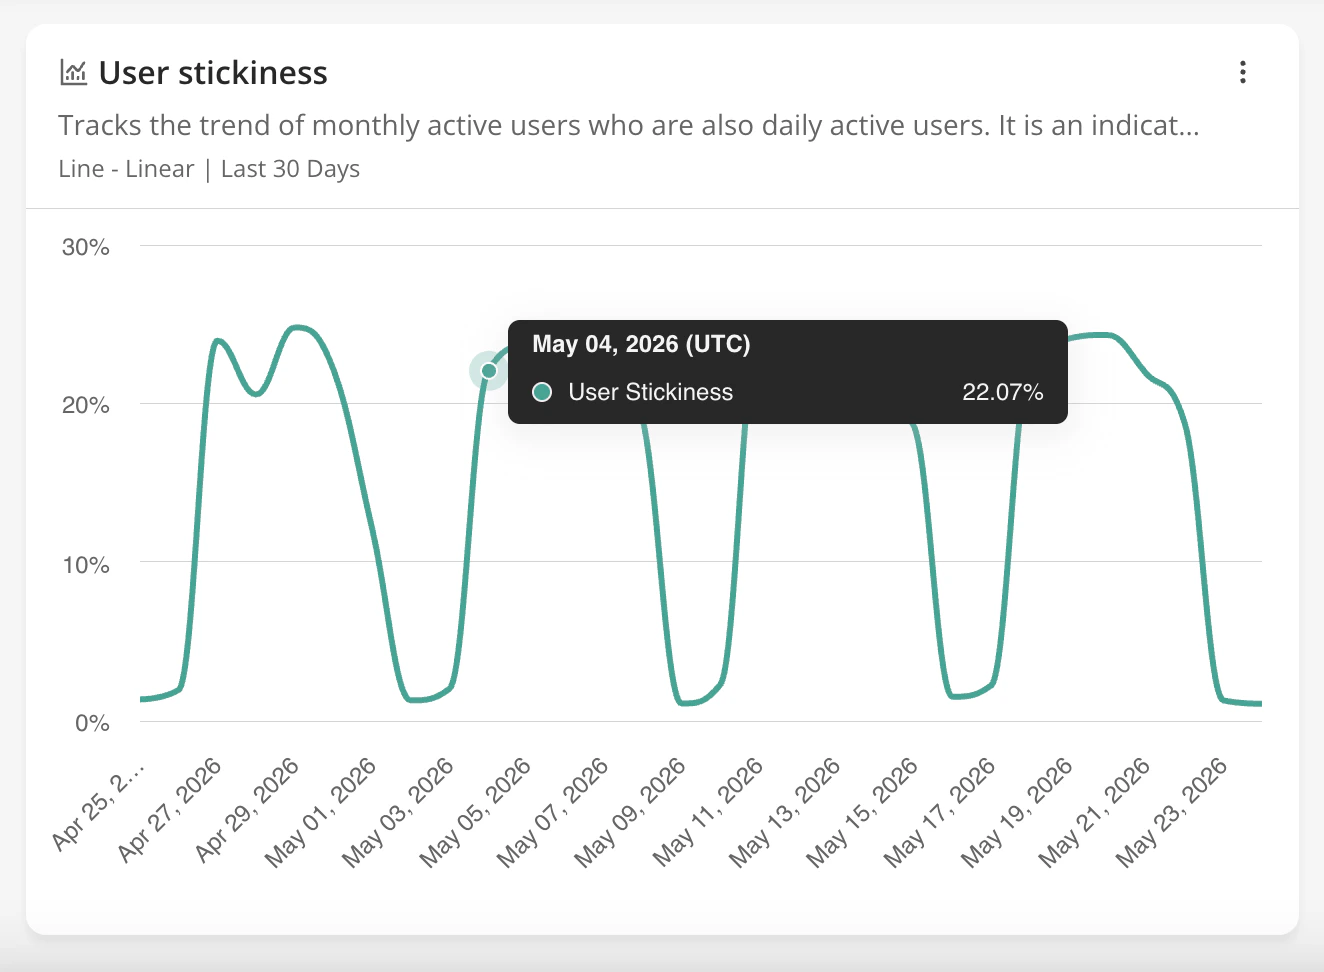
Most Visited Pages
The Tagged Pages within the product that have received the most visits. This list will show the top 10 pages.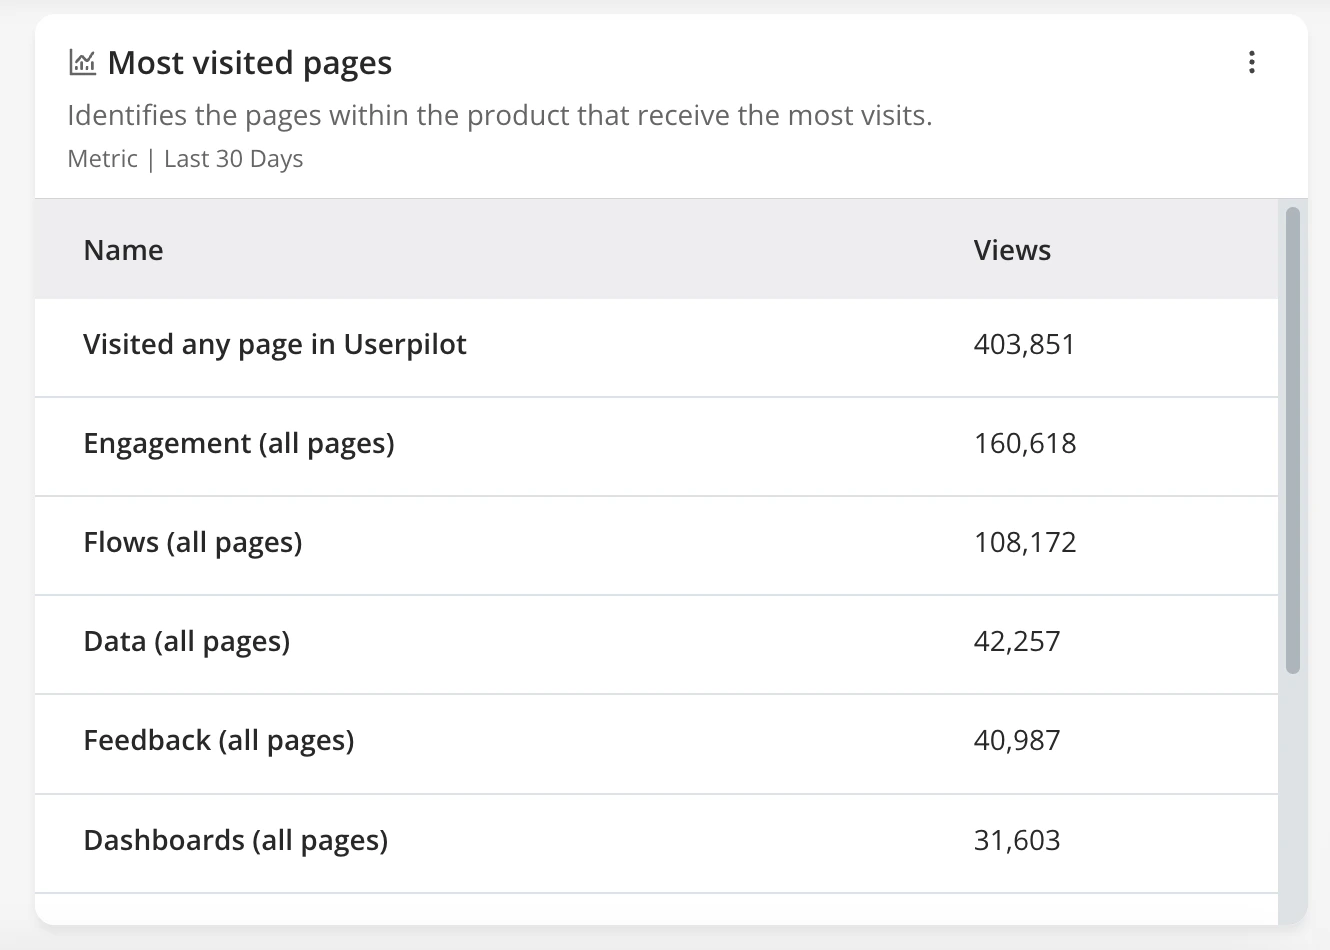
Most Popular Features & Events
The labeled events, tracked events, custom events, or tagged features that occurred most frequently. This list will show the top 10 events.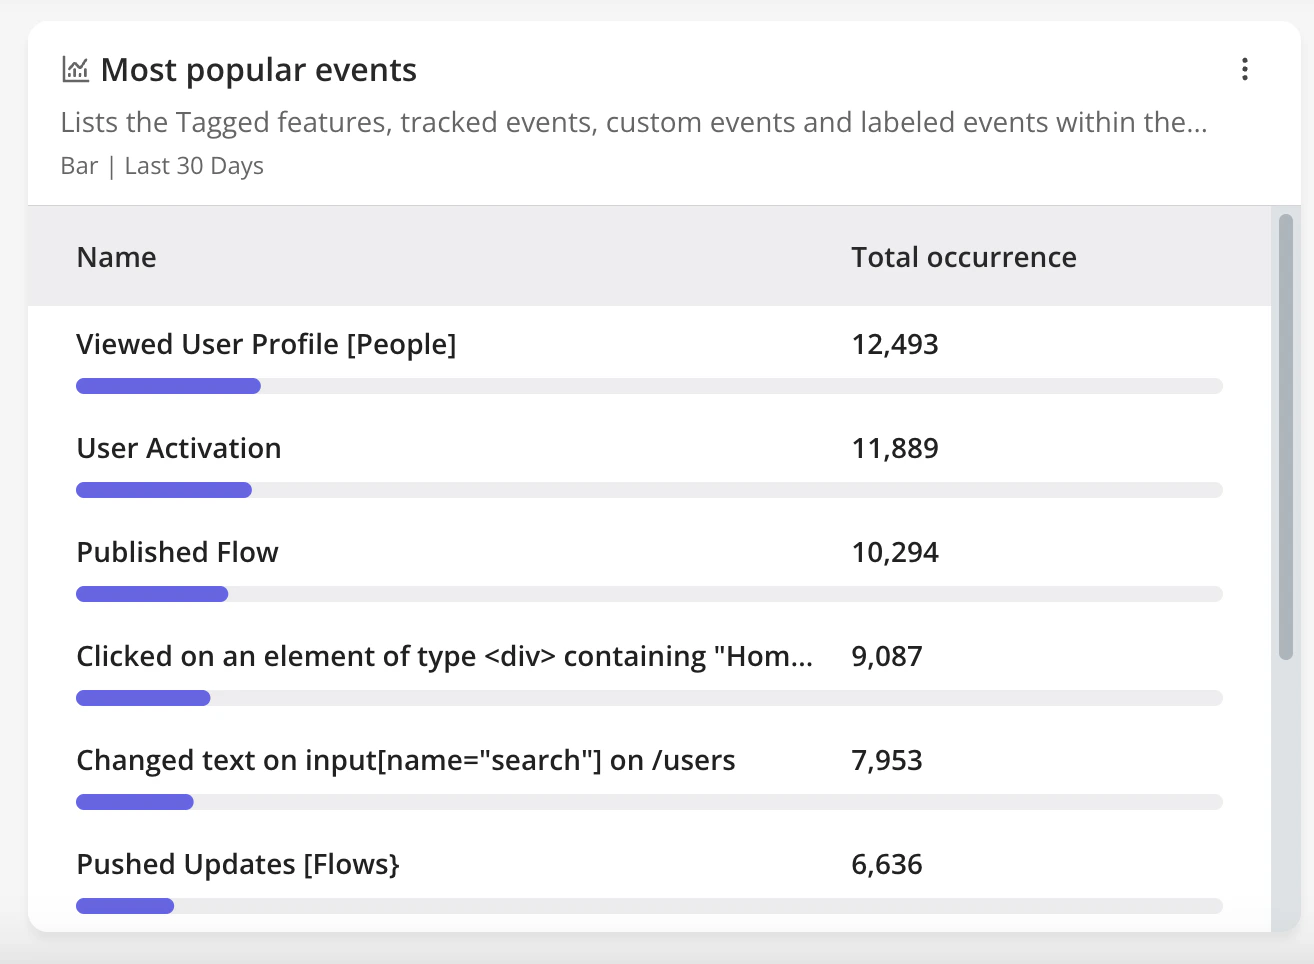
Top Engaged Users
Lists the 10 users who have interacted most with the product. Users are considered most engaged based on their event occurrences (labeled events, tracked events, and feature tags), web page views and mobile screen views.Top Engaged Companies
Lists the 10 companies who have interacted most with the product. This list will show the top 10 companies. Companies are considered most engaged based on their event occurrences (labeled events, tracked events, and feature tags), web page views and mobile screen views.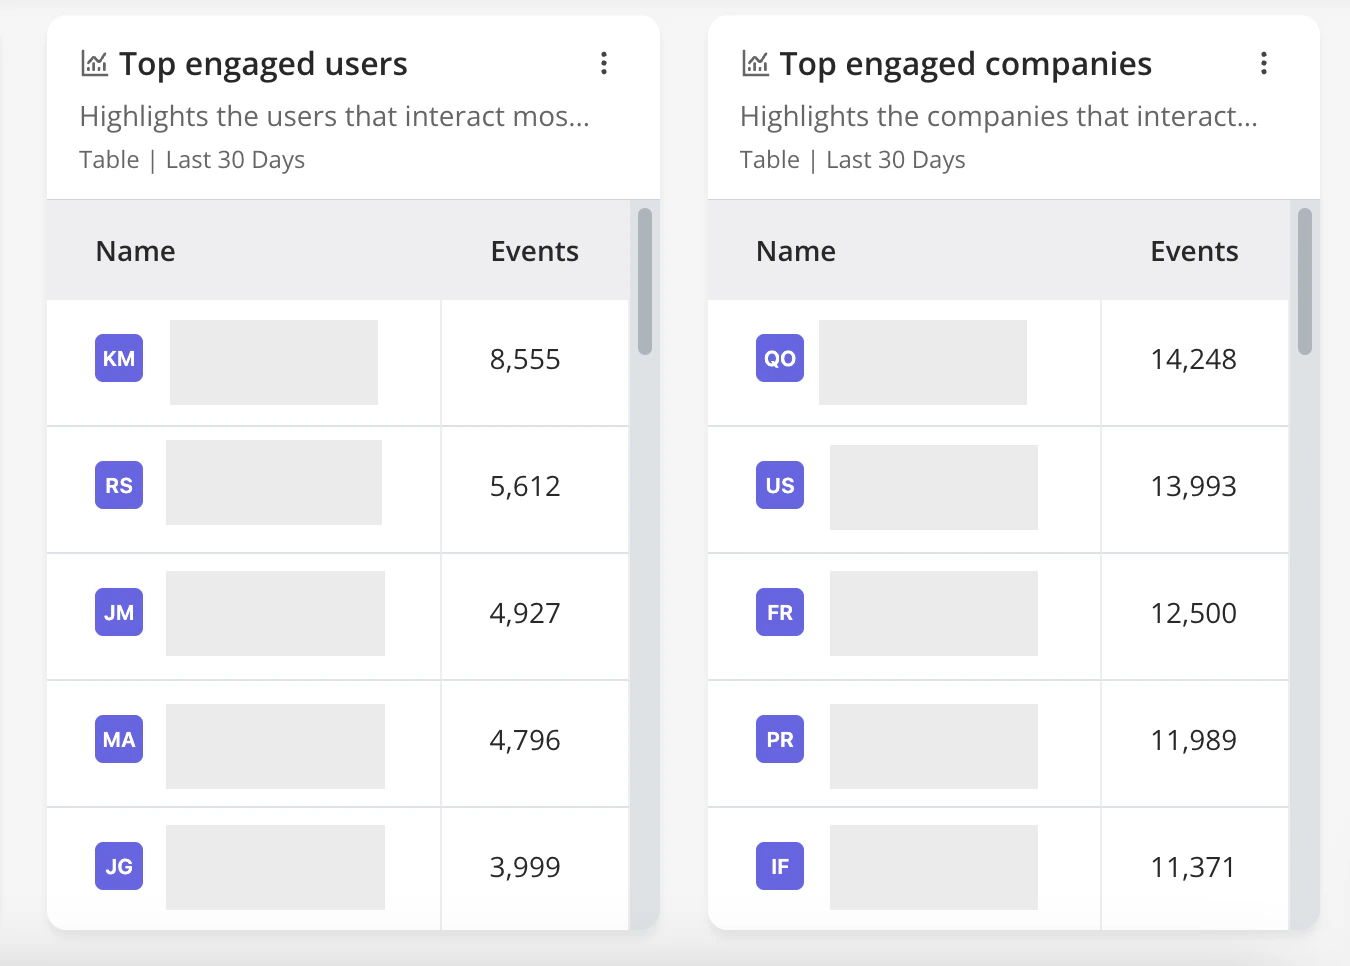
Page Views Distribution
Displays Tagged Page views by plotting the total number of unique users who visited each page alongside the average number of views per user.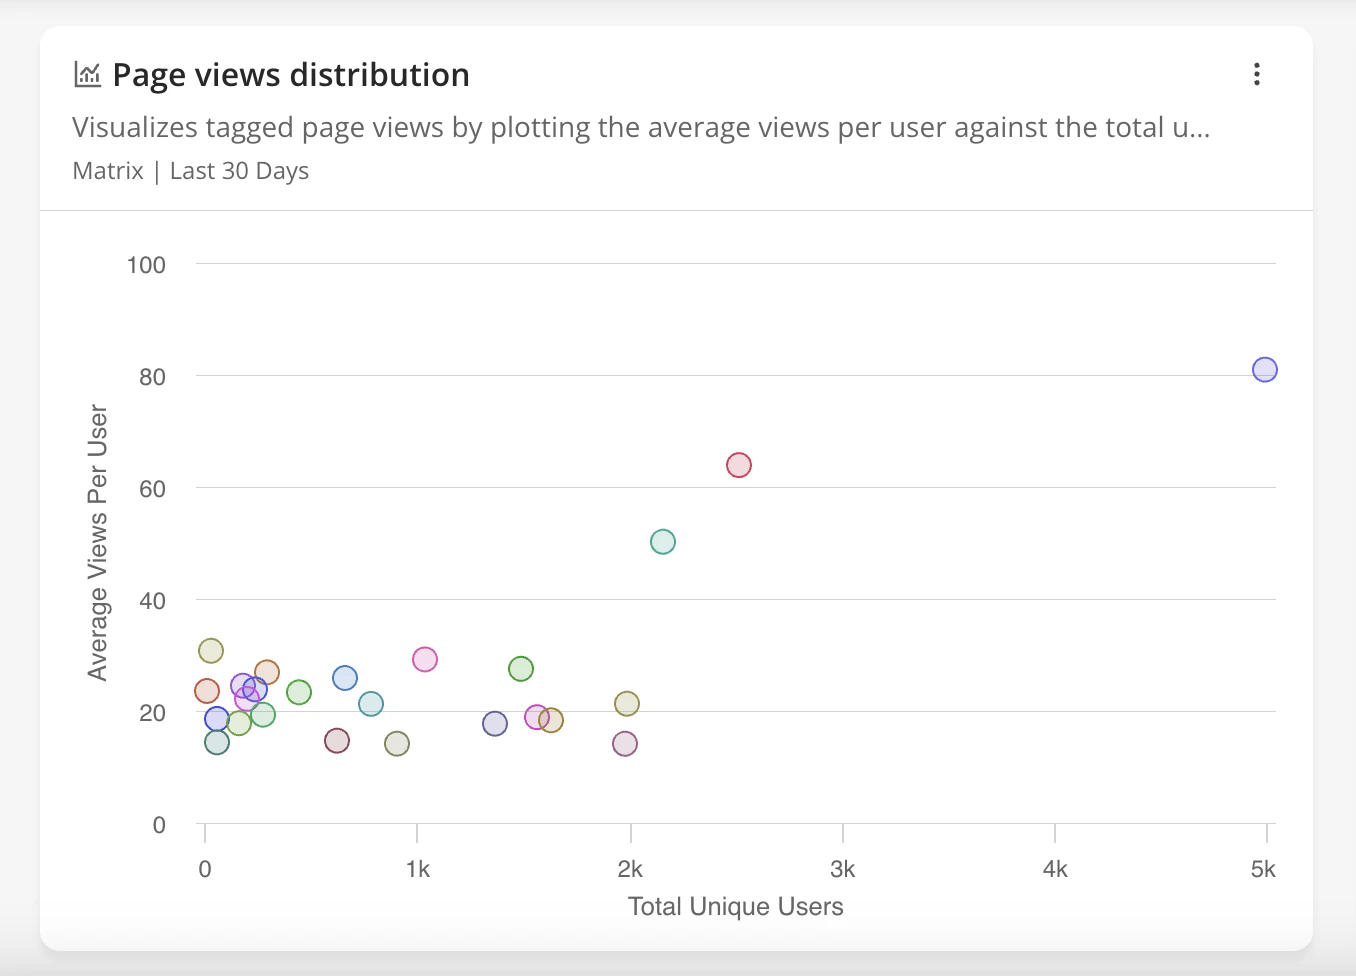
Events Engagement
Displays Event occurrence data (Labeled events, Custom events, Tracked events and Feature tags) by plotting the total number of unique users who completed the event alongside the average number of event occurrences per user.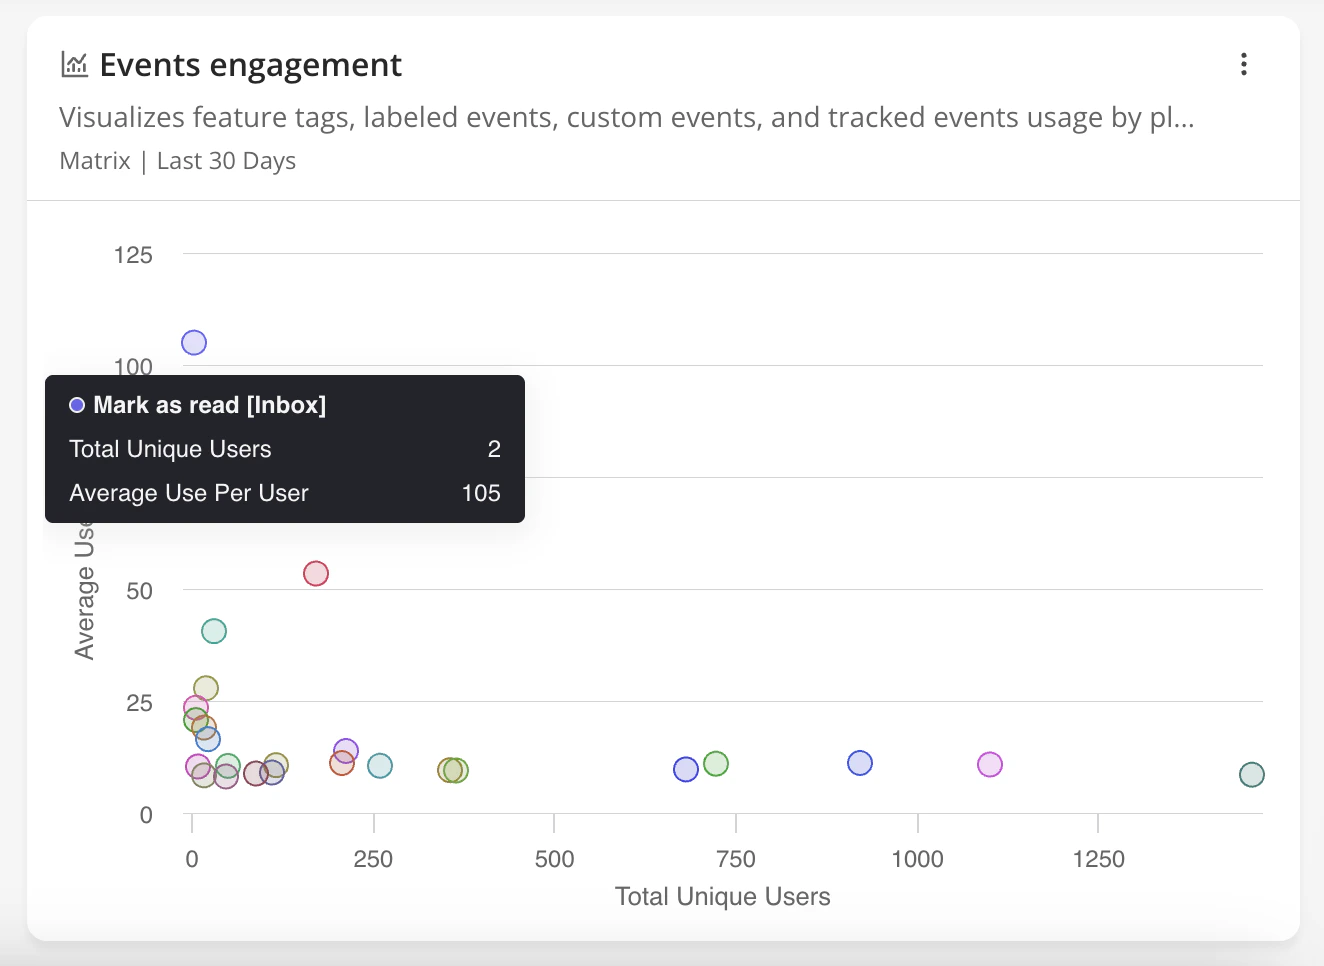
User Retention Analysis
The percentage of users who have returned to the product week after week. To build your own User Retention table, you can look into our documentation here.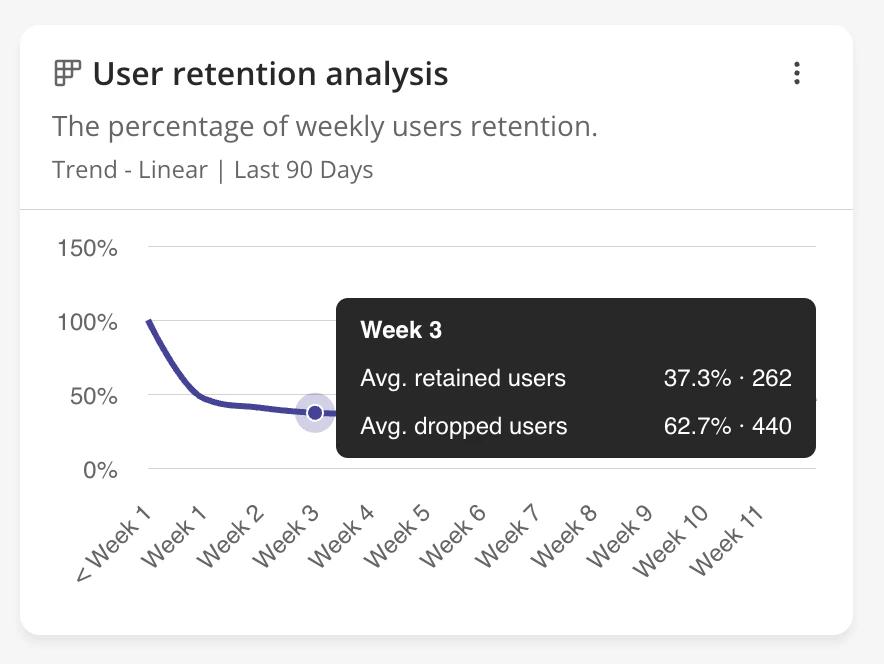
Hourly User Activity
Shows the number of unique active users for each hour of the day. This chart will take into account unique users per hour. (E.g., if a user logs in at 2.30PM, and continues their session until 5PM → they will count as a unique user in each of those hour brackets [2PM, 3PM, 4PM and 5PM]).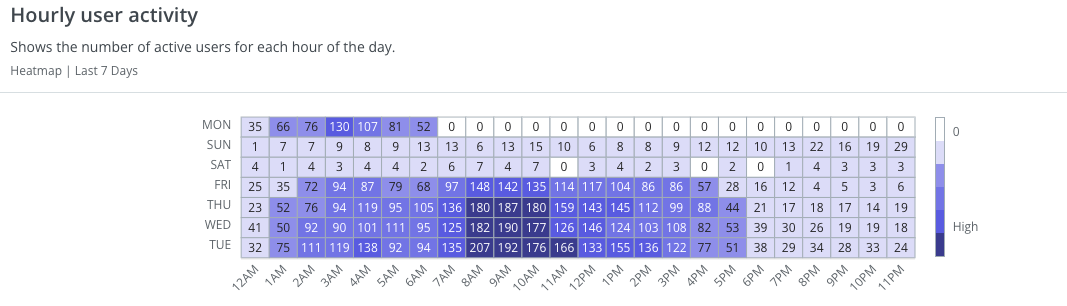
Average Session Duration
The average amount of time spent on the platform per session.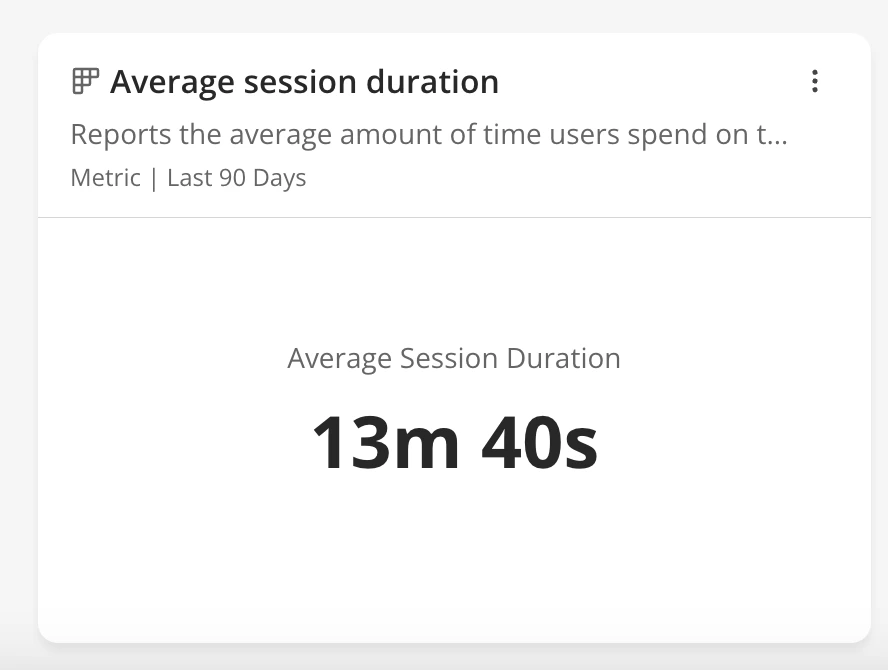
Product Usage by Browser
A breakdown of product usage by browser type.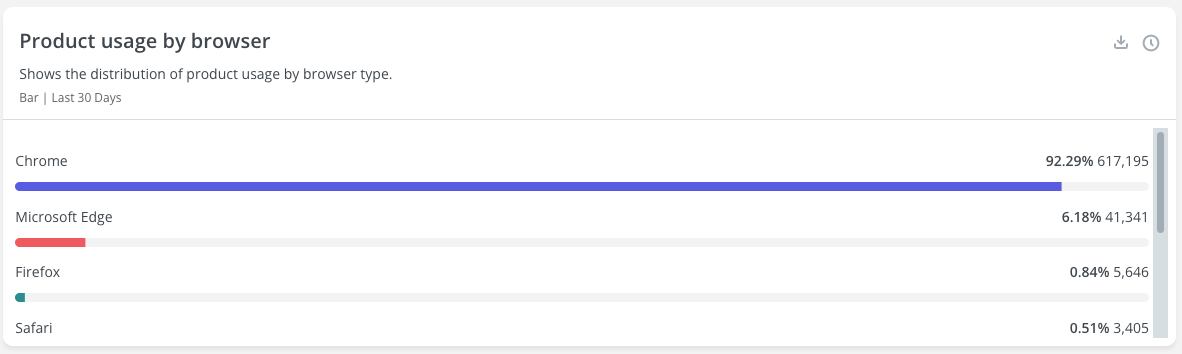
Most Visited Mobile Screens
The mobile screens within your application that have received the most visits. This list will show the top 10 screens.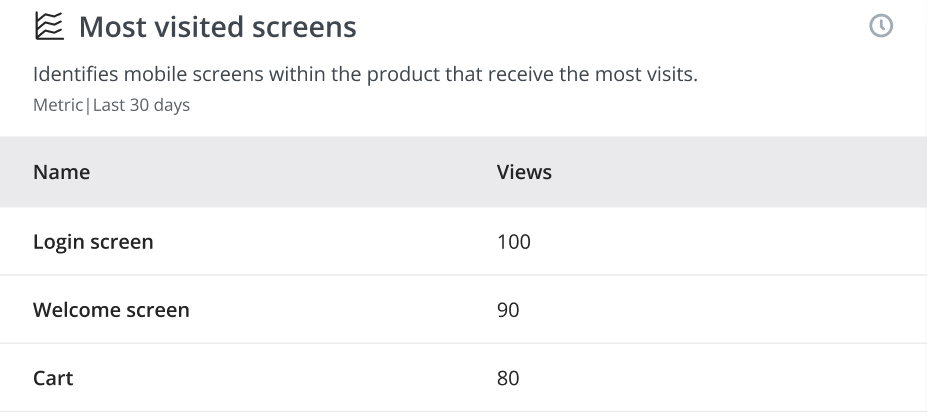
Mobile Screen Views Distribution
Displays mobile screens views by plotting the total number of unique users who visited each page alongside the average number of views per user.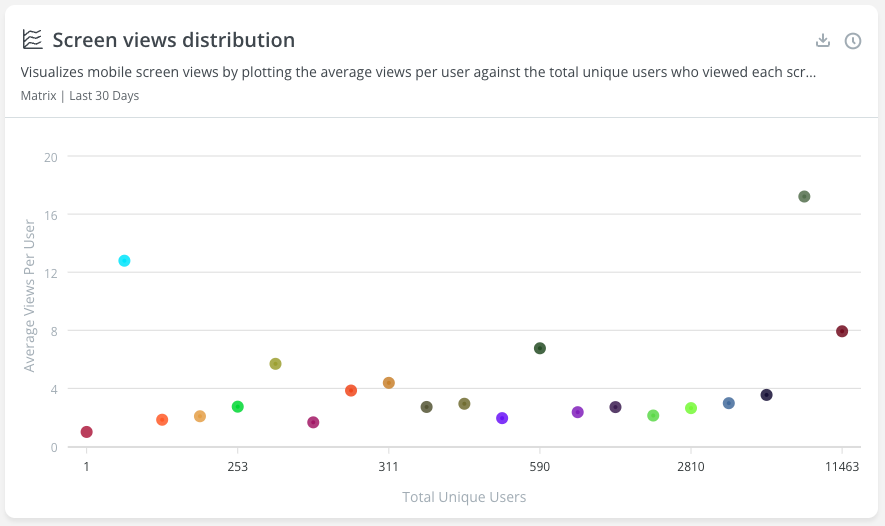
FAQs
How often is product usage data updated in Userpilot?
How often is product usage data updated in Userpilot?
Although Userpilot updates product usage data in real-time, allowing you to monitor user interactions and feature engagement as they happen, you would be able to refresh the dashboard reports every 10 minutes.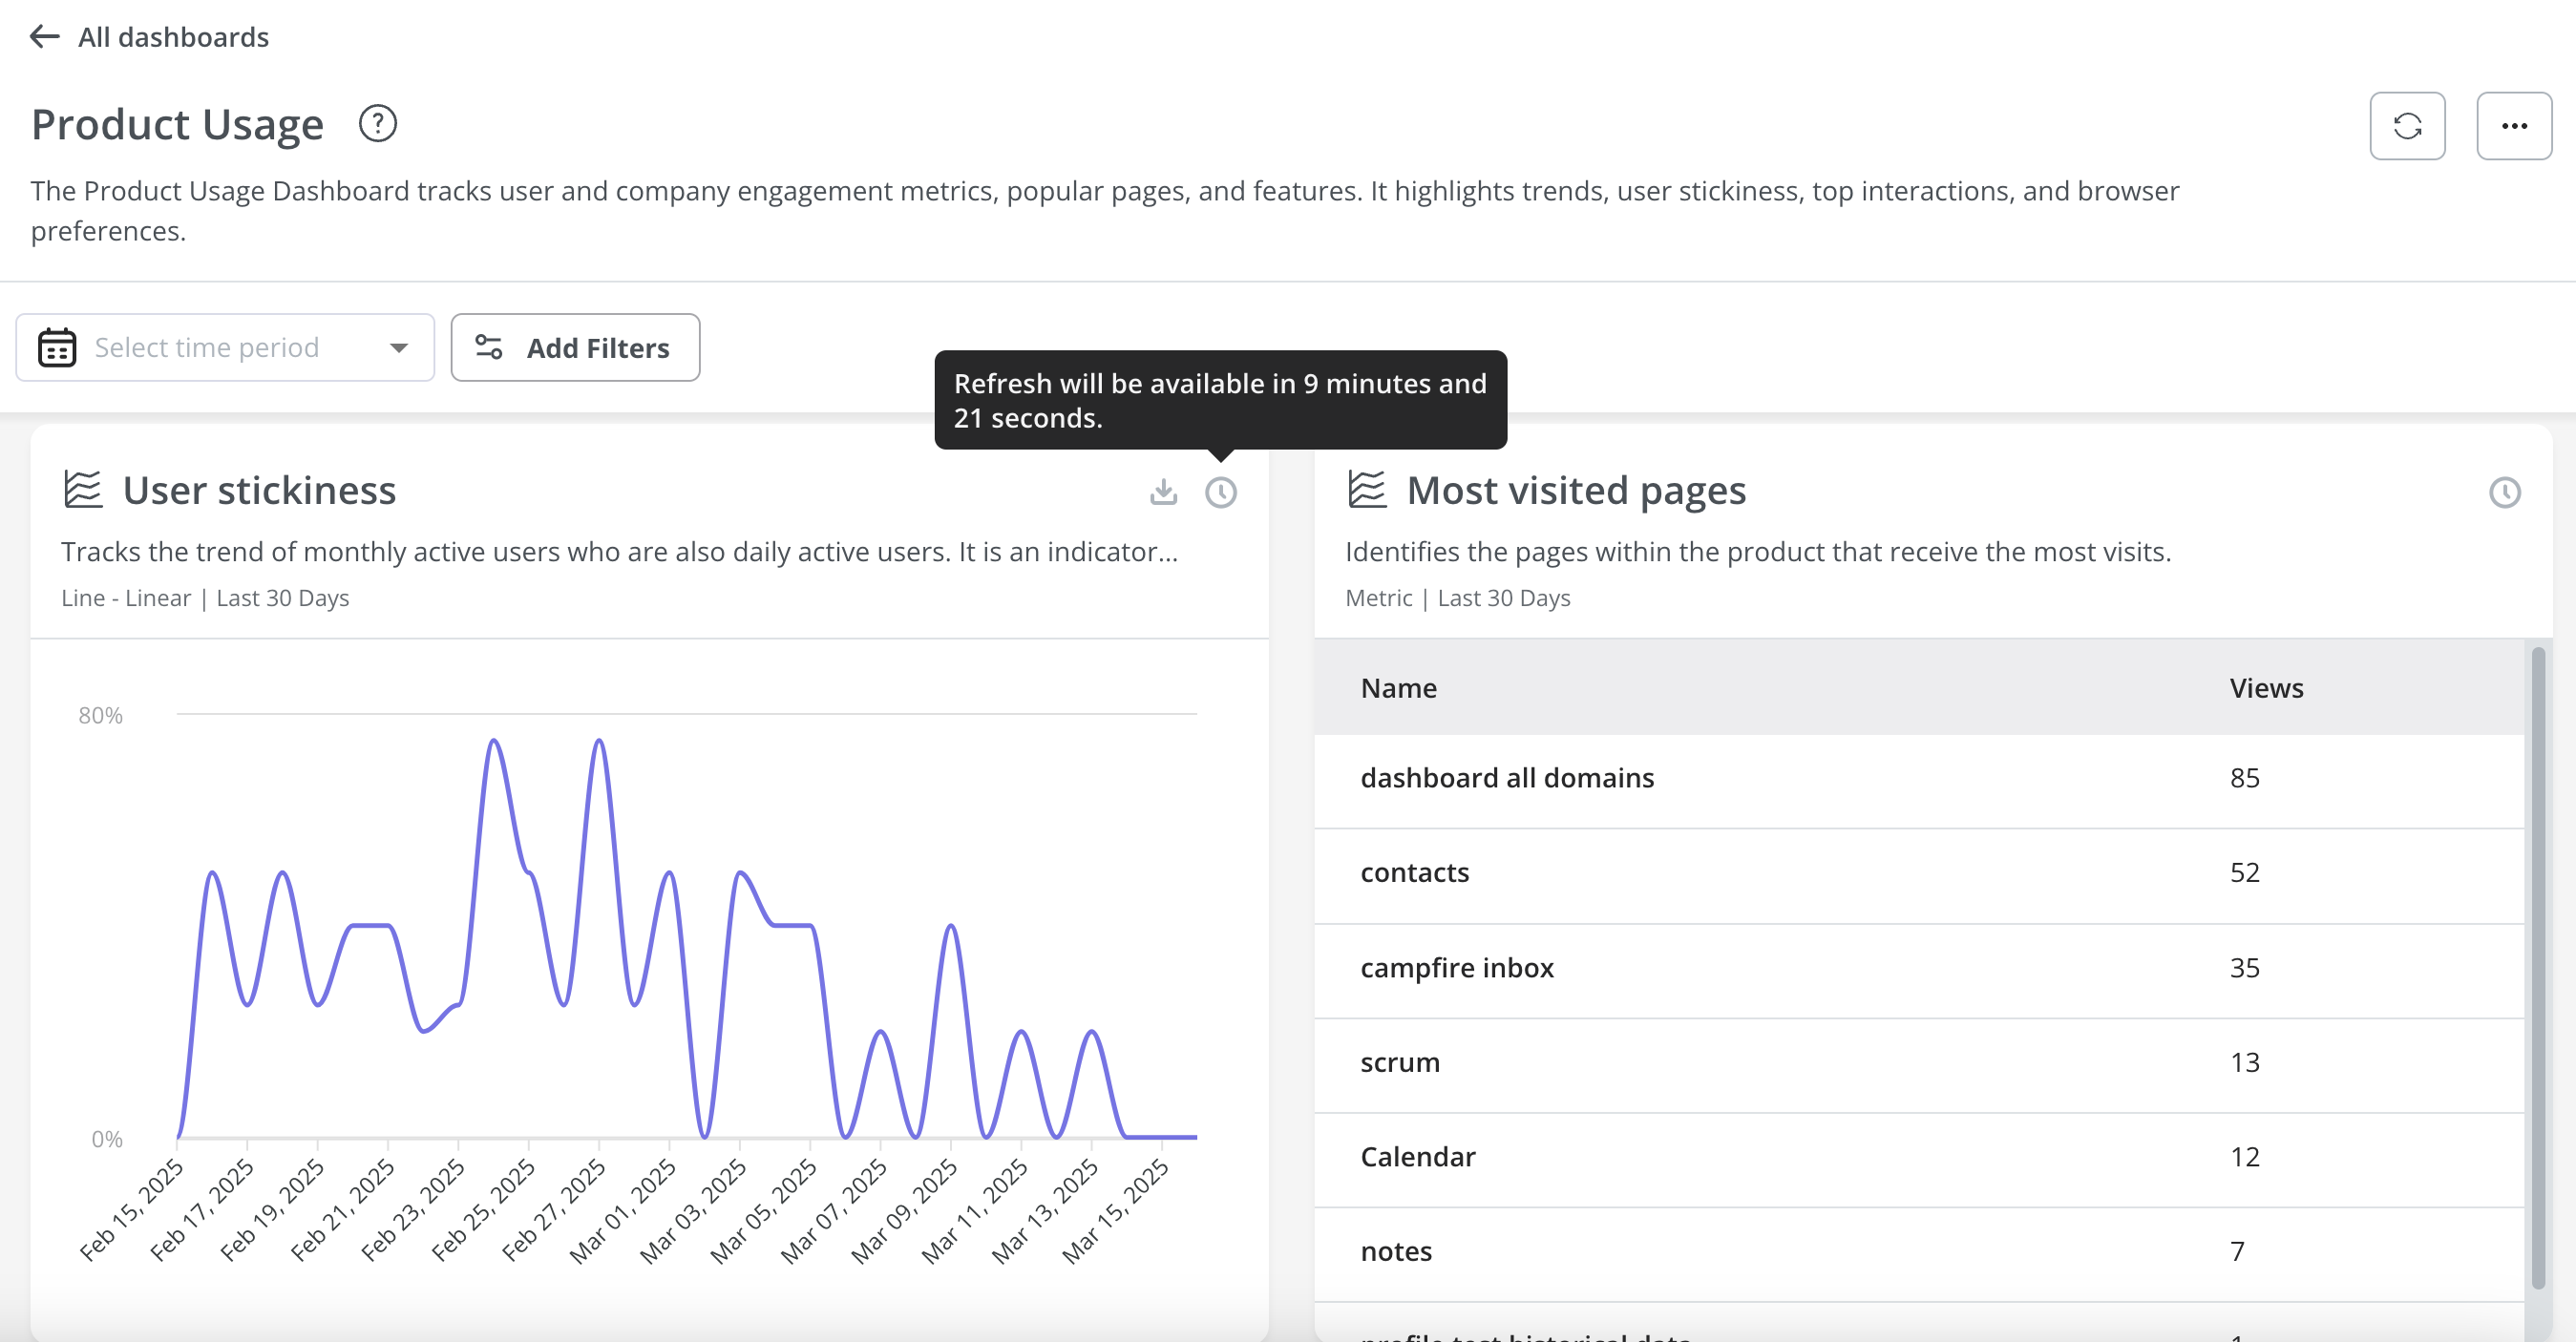
Can i edit product usage dashboard?
Can i edit product usage dashboard?
No, the Product Usage Dashboard powered by Userpilot cannot be edited. It contains special reports and metrics that are exclusive to this dashboard and cannot be recreated in the Analytics section. However, you can still filter data by user segments and time periods to gain more relevant insights.