Retention Reports are only available for Growth and Enterprise plans.
Use cases
- Measure ongoing engagement – See how many users remain active after a set time period (e.g., two weeks after signup).
- Track feature stickiness – Monitor what percentage of users continue performing key actions (e.g., continue using key feature after seven days).
- Analyze retention trends – Understand how retention rates (e.g., key feature retention) change over time.
- Uncover behavioral patterns – Identify how frequently users return within specific time windows (e.g., interacting with key feature every day).
Getting Started with Retention Reports
To get started with creating a Retention report, navigate to the Retention page from the navigation bar or through the ‘Create Report’ button within the Saved Reports page.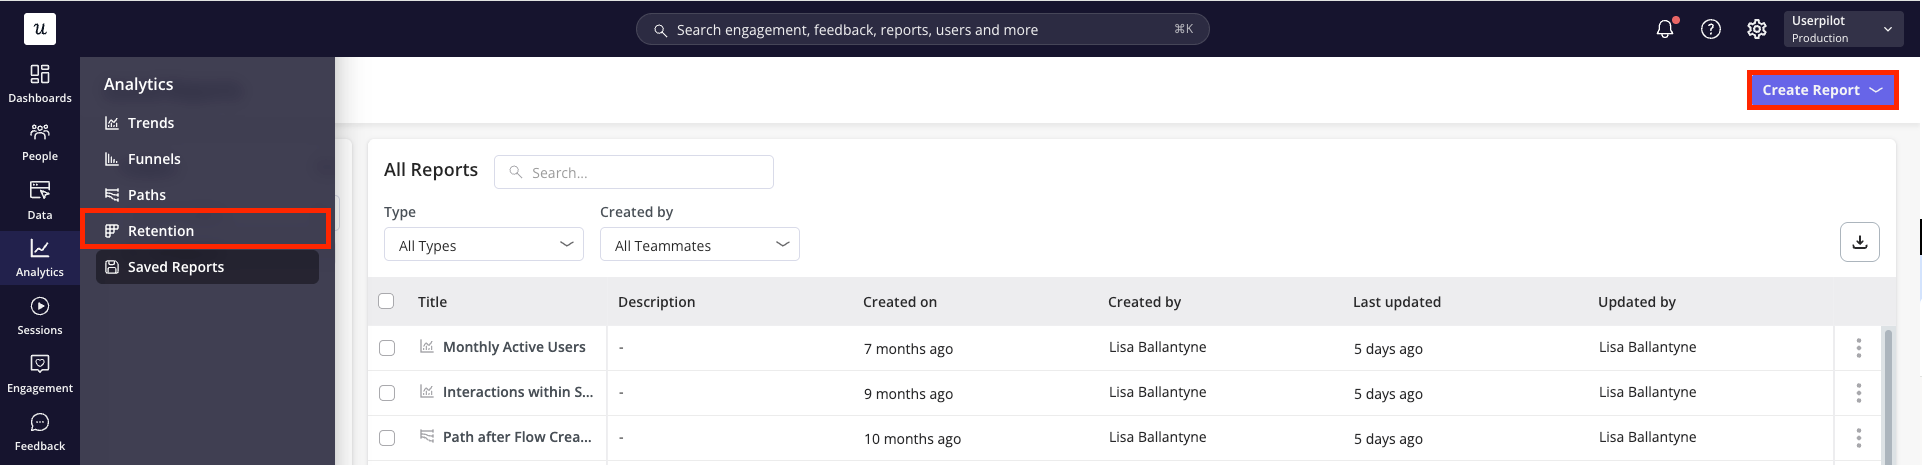
Building your Retention Report
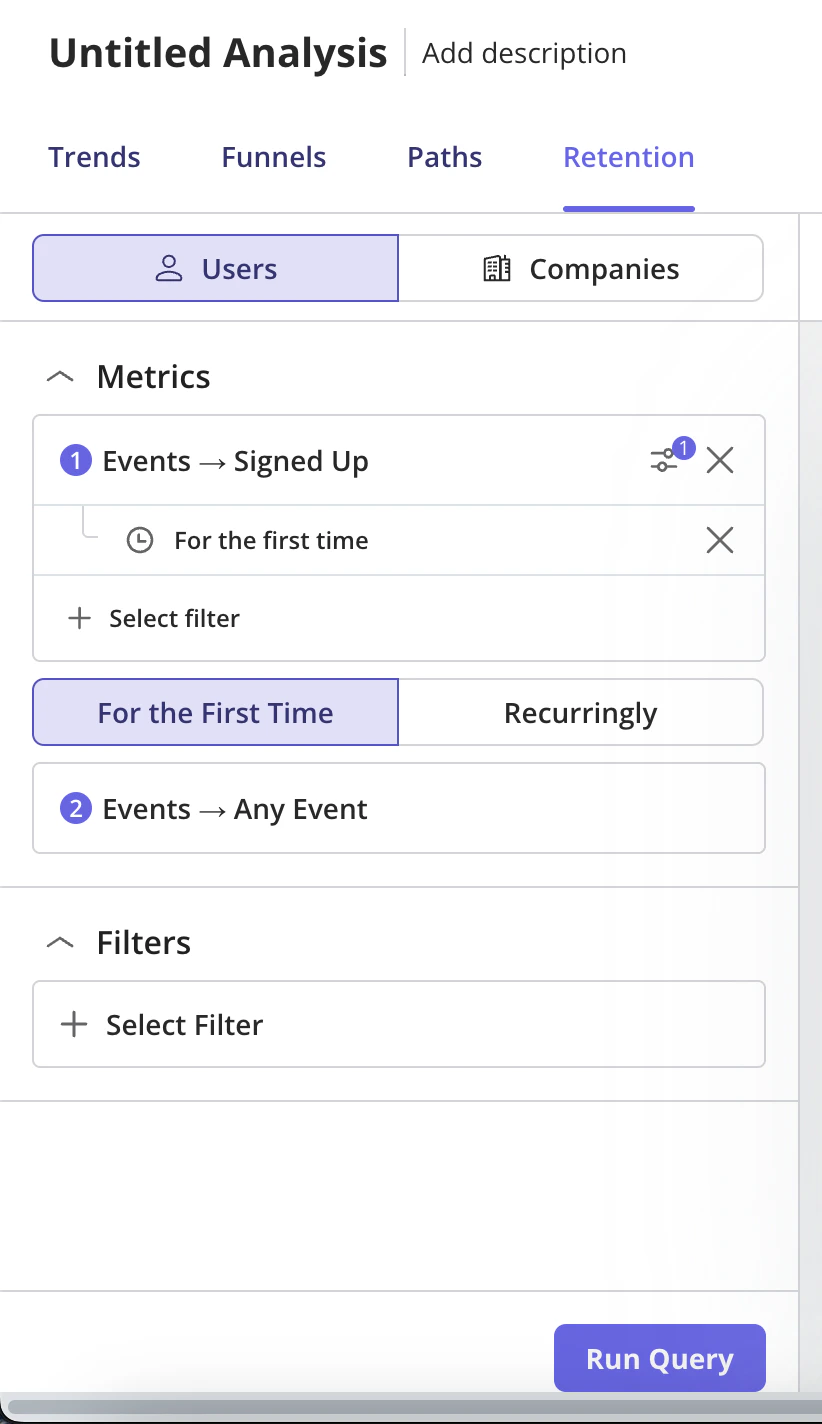
- Starting metric
The Starting metric is the first action users or companies must perform to be included in the retention report. You can choose whether this metric should be counted:- For the First Time
Counts users or companies only when they perform the starting metric for the first time during the selected period. This option can be found by clicking the event action menu on the starting metric. Use case: Use this when you want to measure cohort-based retention, such as how many new users return after signing up for the first time. - Recurringly
Allows users or companies to re-enter the retention report every time they perform the starting metric during the selected period. Use case: Use this when you want to measure repeated behavior, such as how often users return after creating a report, launching a flow, or completing a recurring product action. - Filter your data to focus only on the most relevant information. Metrics can be filtered by:
- Event Properties (for inline filters only)
- User Properties (for user-level data only)
- Company Properties
- Segments
- For the First Time
Analyzing your Results
Click ‘Run Query’ and choose the right data presentation options for your needs. Within the header, specify the a. Chart period: choose a time period from the default options (e.g. past 7 days, past 30 days, etc.) or specify a custom date range b. Platform: focus on data from all platforms or choose to filter to only web or mobile data c. Data point period: specify whether each data point should represent a day, week or month d. View of data: choose between a split view or focus solely on the chart or table data.png?fit=max&auto=format&n=j6BdSiRiF3SCgUJf&q=85&s=29f3b092b08f096ad349f5bd2cc2cb76)
Retention report types
When analyzing retention, you can view the report using one of the available retention types:- Retention Trend Shows the average retention and drop-off rate over time after the starting event. For example, regardless of when a user performs the starting event, if they return and complete the returning event the next day, they are counted in the Day 1 retention data point. Purpose: Helps you understand how retention changes across days, weeks, or months after users first perform the selected event.
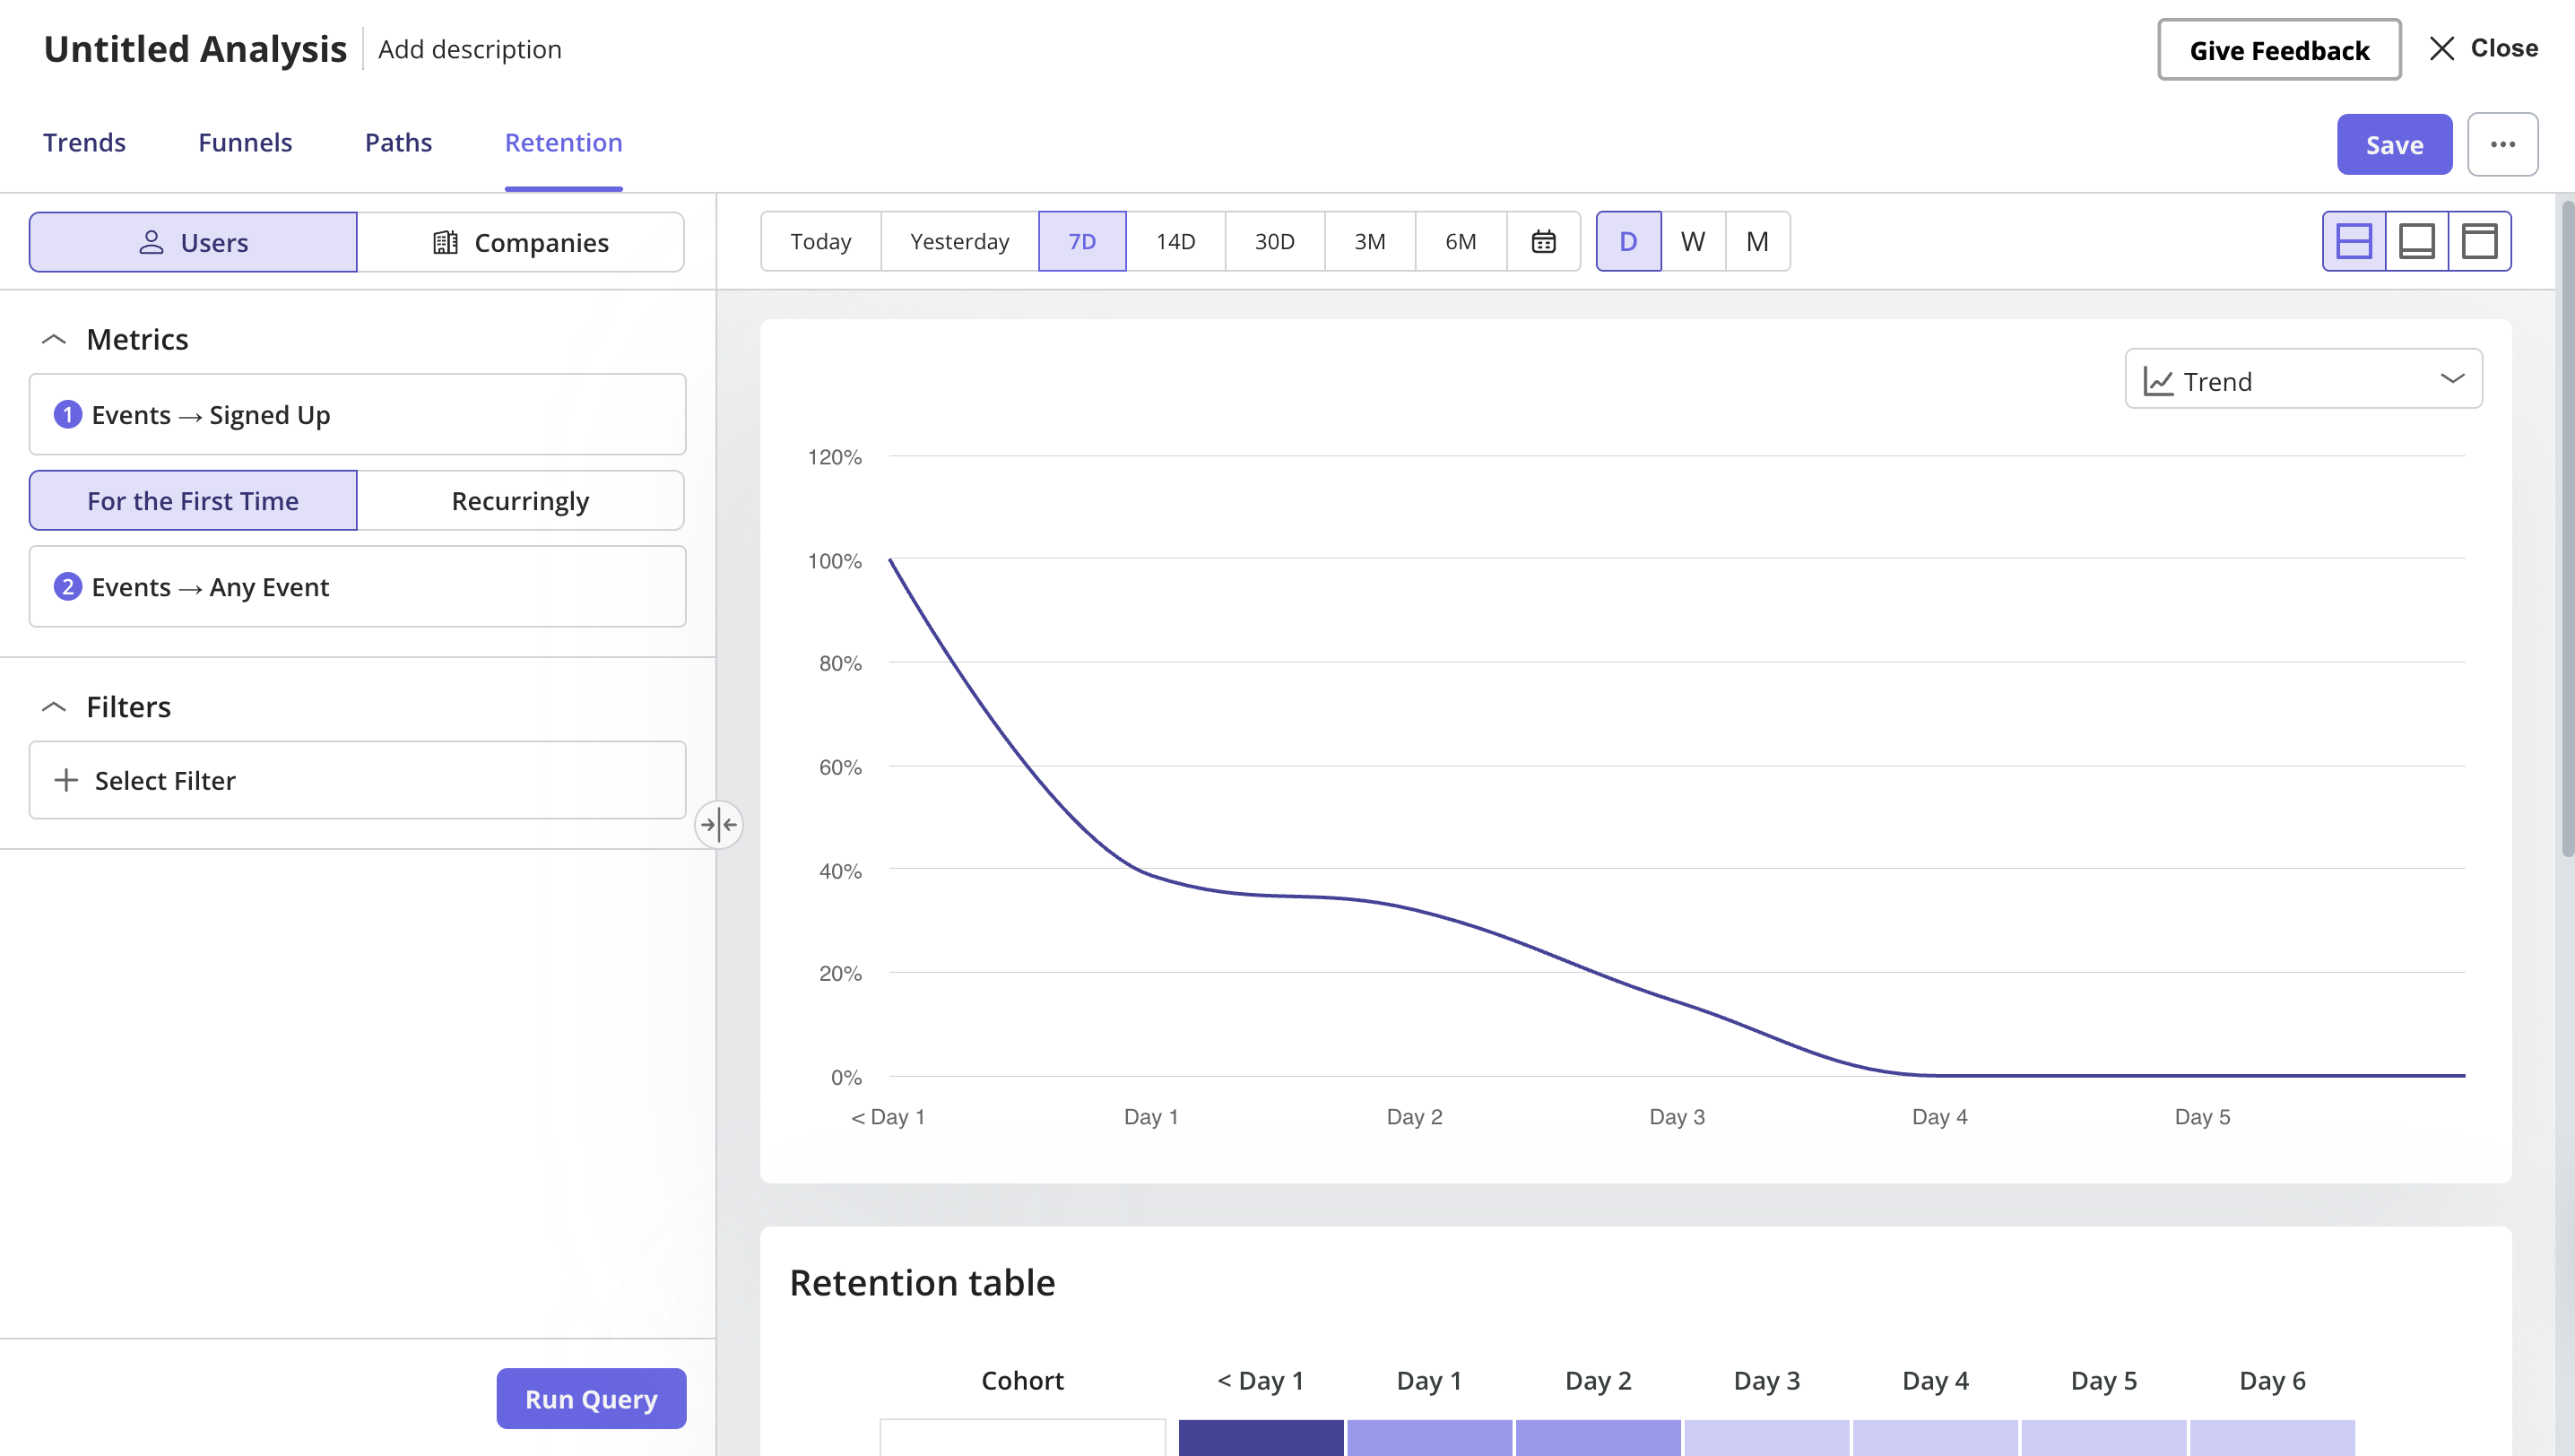
- Retention Metric Shows the retention percentage for a specific selected period, such as Day 1, Week 1, or Month 1. How it is calculated: Userpilot calculates the percentage of users who performed the starting event for the first time and then returned to perform the returning event within the selected retention period. Purpose: Helps you quickly measure retention for a specific period without needing to analyze the full trend or table. For example, you can use it to track Week 1 retention as a key retention KPI.
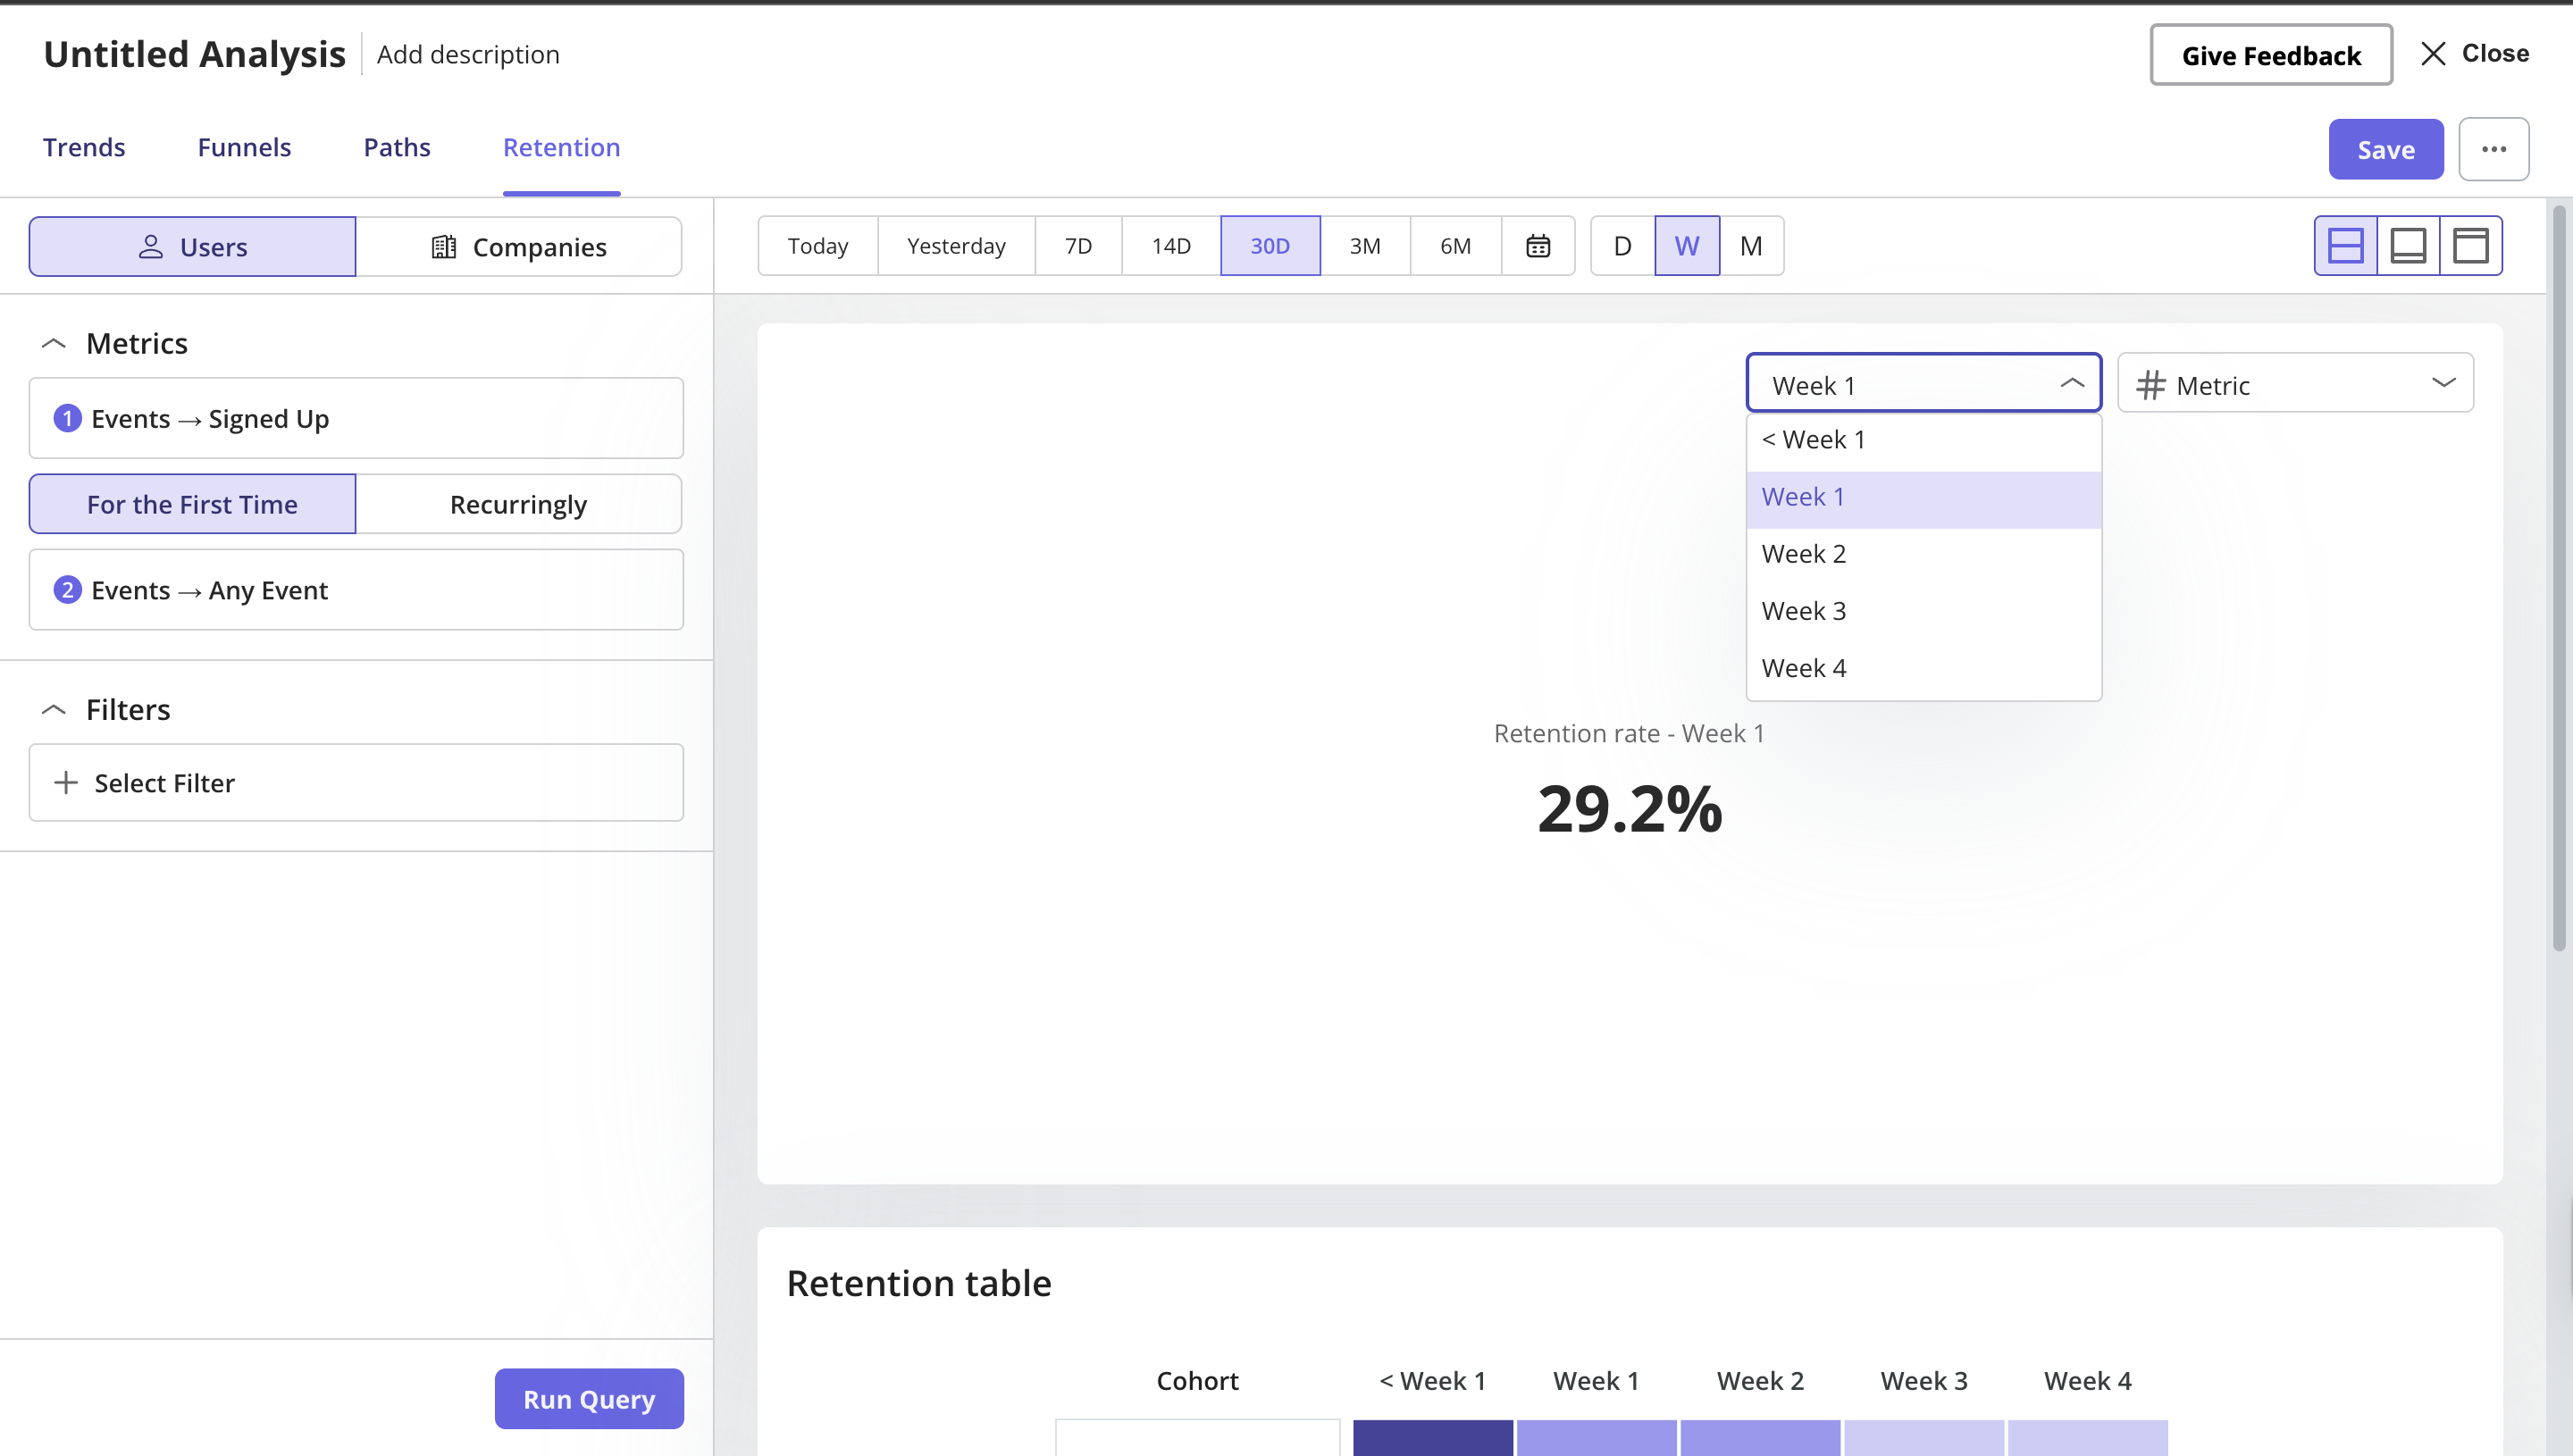
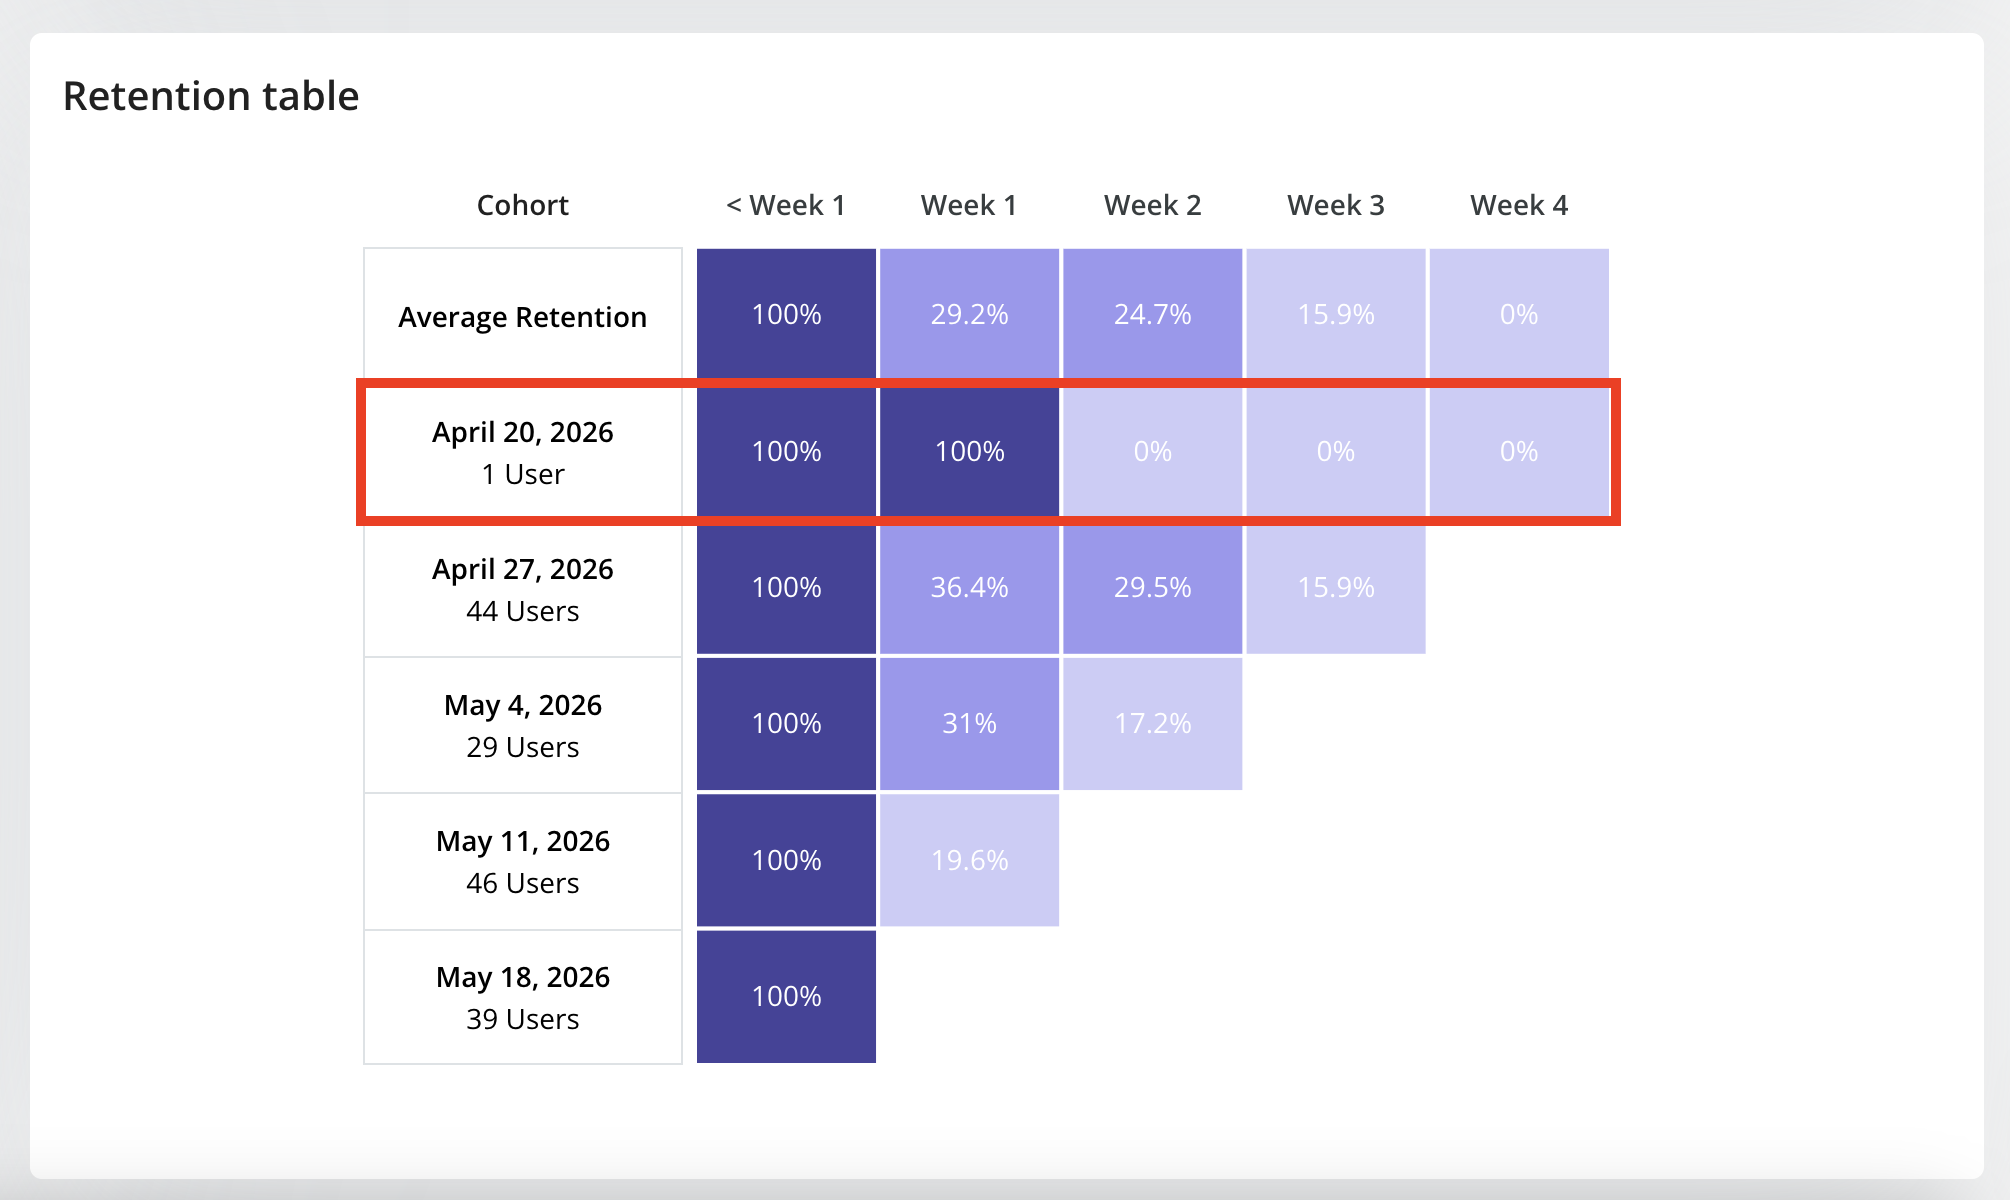
- Retention Table Shows a detailed breakdown of retained and dropped-off users for each day, week, or month in the selected period. Purpose: Helps you inspect the exact retention numbers behind the trend and compare retention across cohorts.
Example
For example, if you run a query with the starting event as “Created Report” and the returning event as “Viewed Report”:- The highlighted row shows that on October 6th, 15 users created a report.
- Of those 15 users, 66.7% returned to view a report on the same day.
- On the next day (October 7th), 33.3% of the original 15 users returned to view a report, and the pattern continues for subsequent days.