The Core Feature Engagement Dashboard measures usage trends, adoption rate and retention metrics for your product’s most pivotal feature.Documentation Index
Fetch the complete documentation index at: https://docs.userpilot.com/llms.txt
Use this file to discover all available pages before exploring further.
Getting Started
To ensure the dashboard displays meaningful insights, go to ‘Settings’ to specify the corresponding event for:- Core Feature: choose an event that represents the user finding the value moment of your core feature
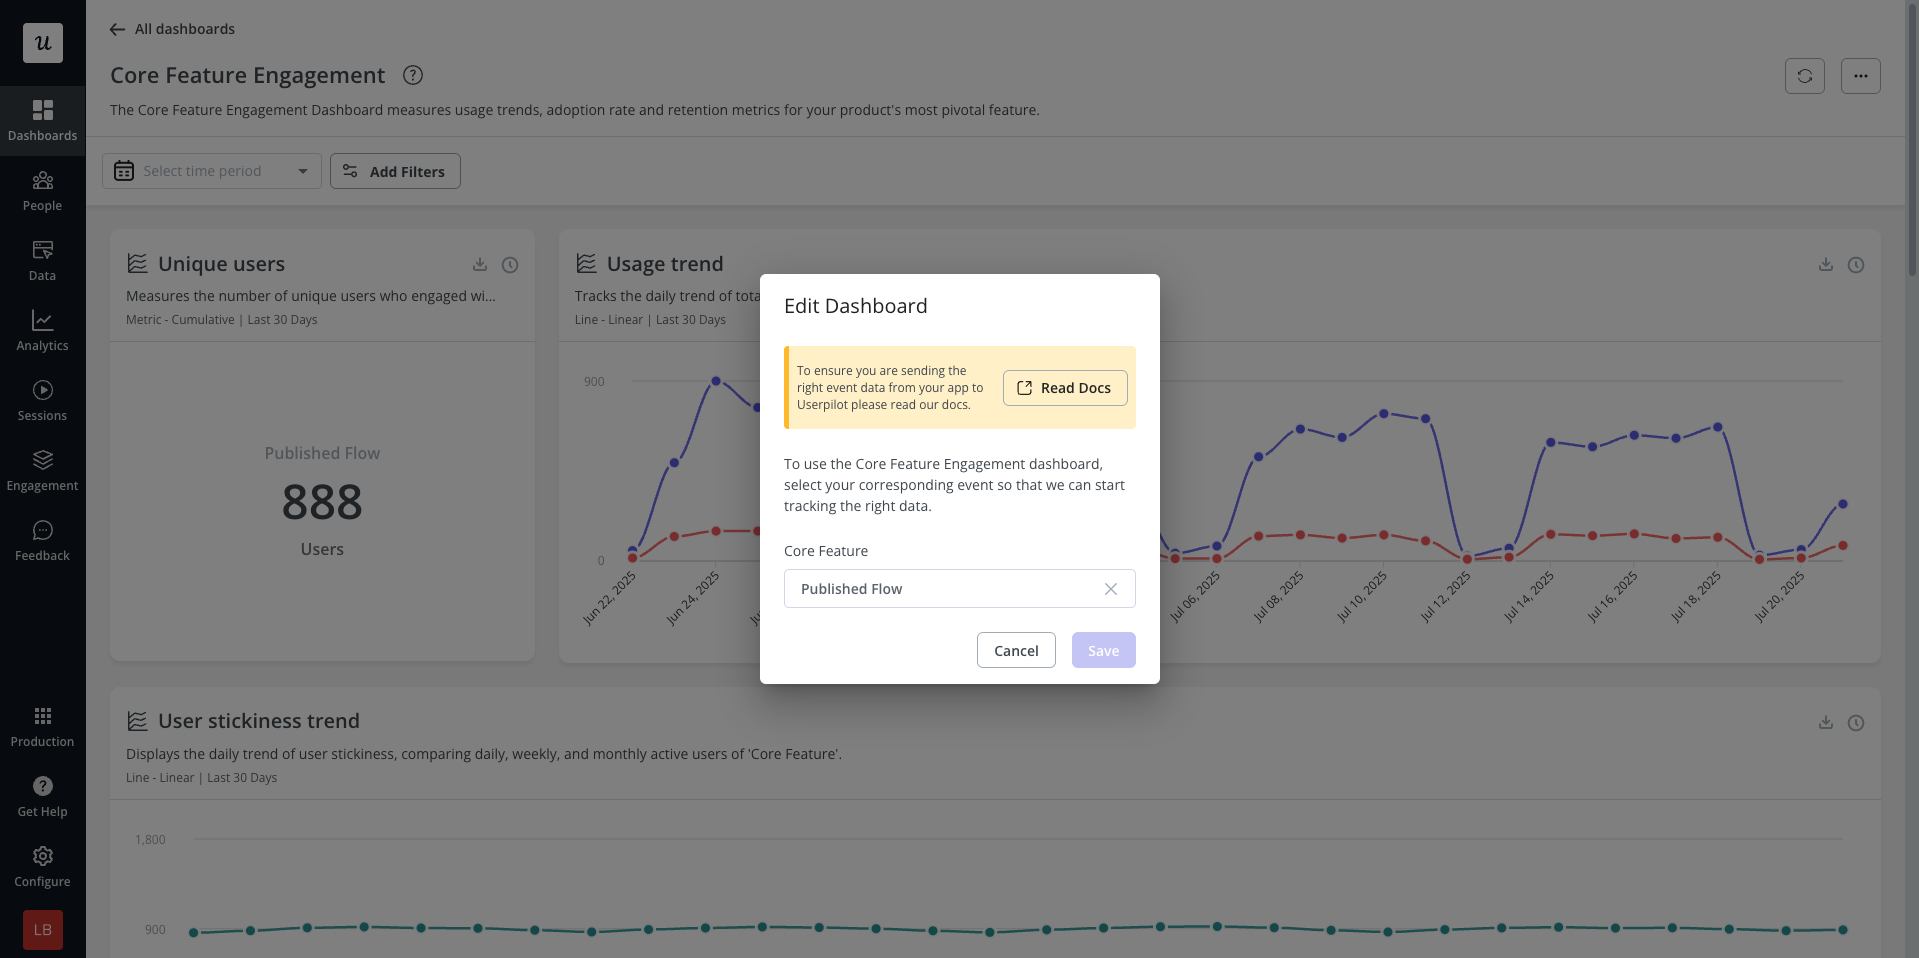
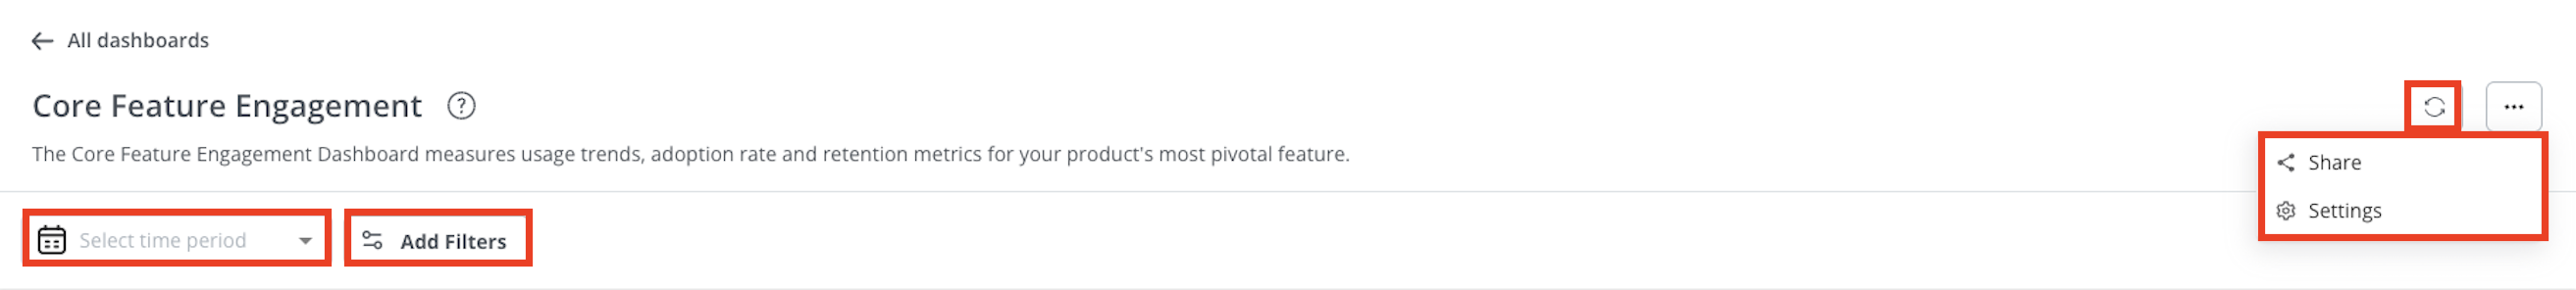
- Share: Use the three dots in the top-right corner to share the dashboard via email with teammates.
- Time period: Select a specific time range for the data displayed in the dashboard.
- Platform (Mobile only): If Mobile is enabled in your account, choose to display data from all platforms, web only, or mobile only.
- Add filters: Narrow the dashboard data to focus on a specific group of users by applying user properties, company properties, or segments.
- Refresh: Click the refresh icon in the top-right corner to update the dashboard data (available every 10 minutes).
Unique Users
The count of the unique users who performed the ‘Core Feature’ event.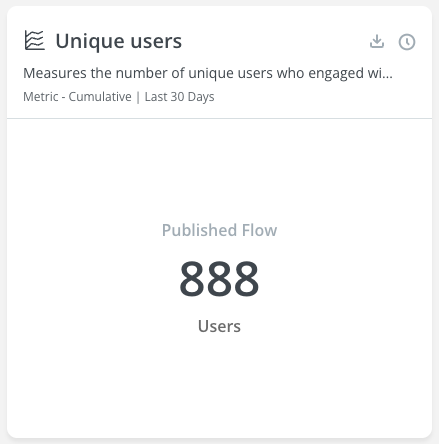
Usage Trend
Shows the daily trend of unique users who performed the ‘Core Feature’ event, along with the total number of times the event occurred.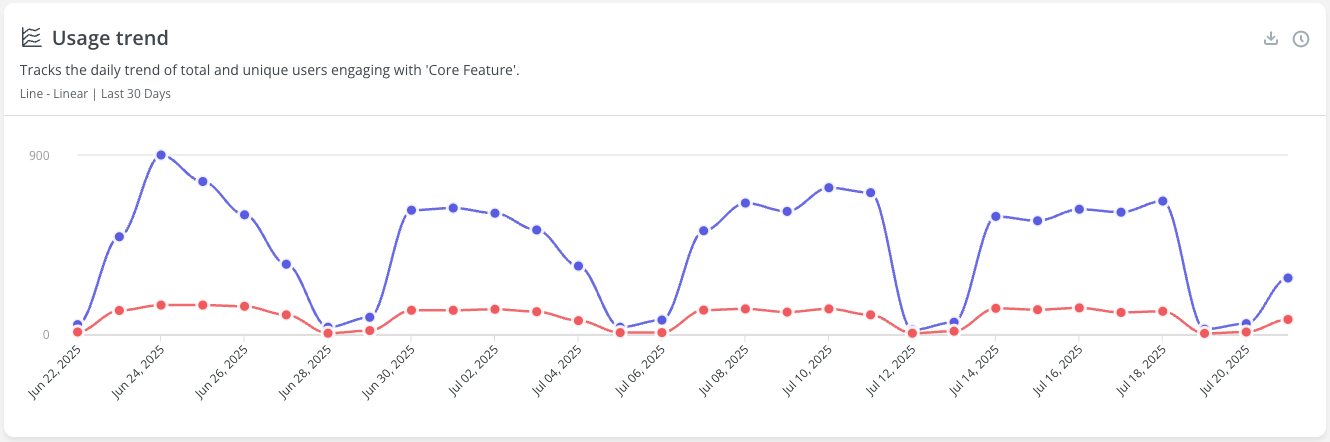
User Stickiness Trend
The daily, weekly and monthly trend of unique users who performed the ‘Core Feature’ event.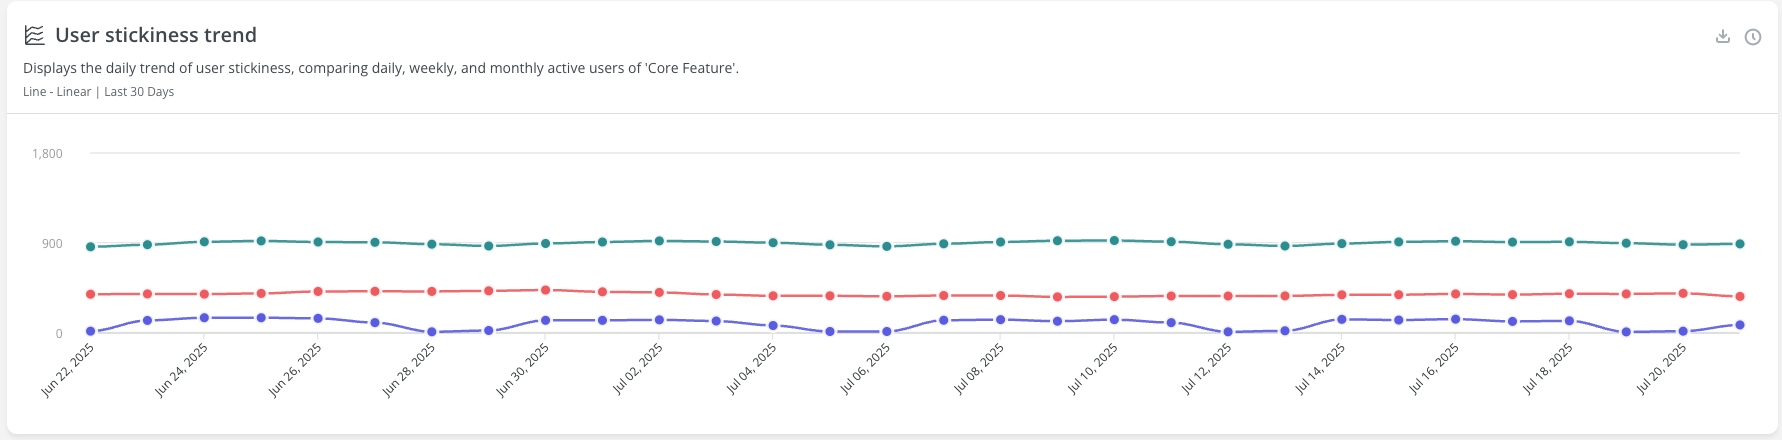
Adoption Rate
The percentage of active users who performed the ‘Core Feature’ event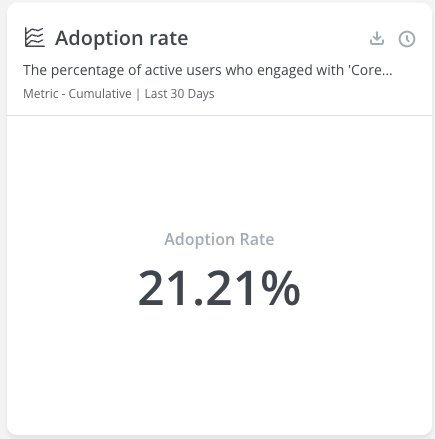
Adoption Trend
The daily trend of the adoption rate (i.e. the percentage of active users who performed the ‘Core Feature’ event).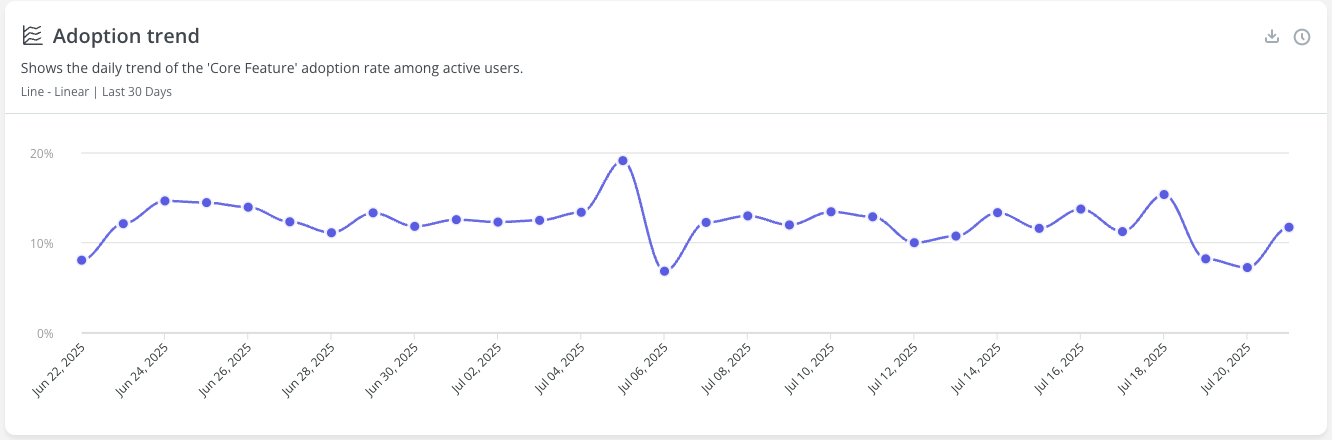
Average Usage
The average number of occurrences of the ‘Core Feature’ event per user.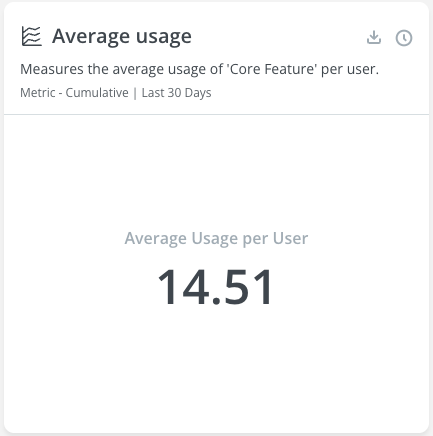
Average Usage Trend
The daily trend of the average number of occurrences of the ‘Core Feature’ event per user.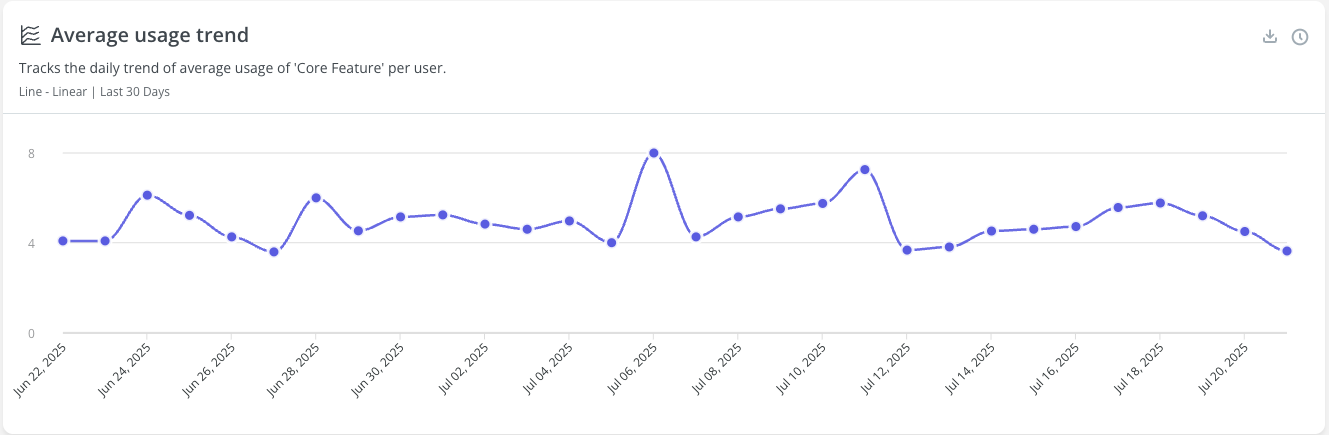
Monthly Retention
The retention rate of users who performed the ‘Core Feature’ event and then returned to perform it again over the following months.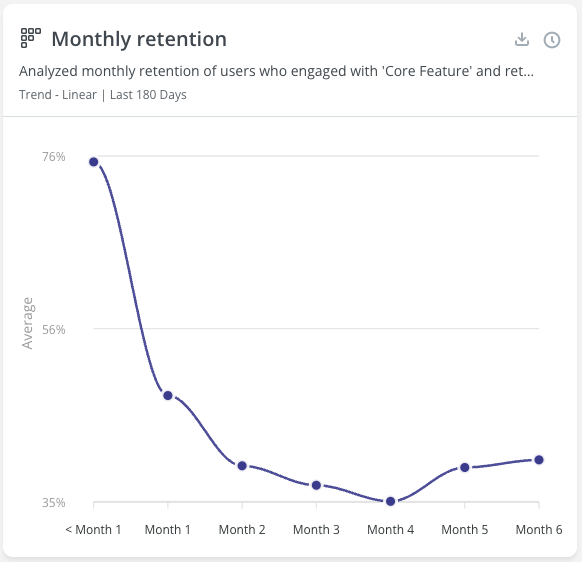
Weekly Retention
The retention rate of users who performed the ‘Core Feature’ event and then returned to perform it again over the following weeks.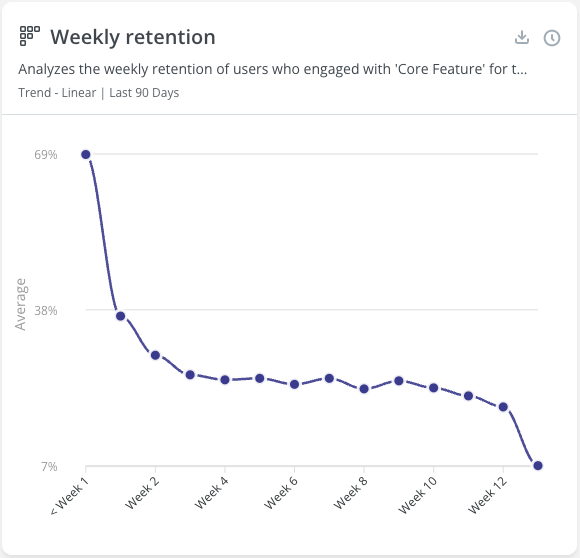
Daily Retention
The retention rate of users who performed the ‘Core Feature’ event and then returned to perform it again over the following days.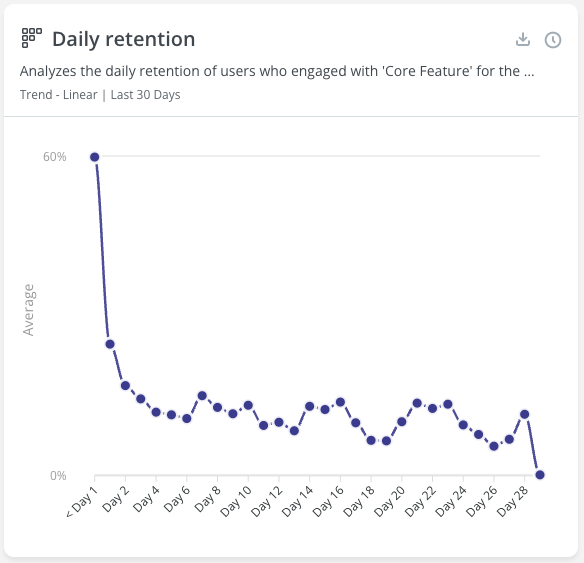
User path before
Shows the most common user paths (event occurrences and pages viewed) directly before performing the ‘Core Feature’ event.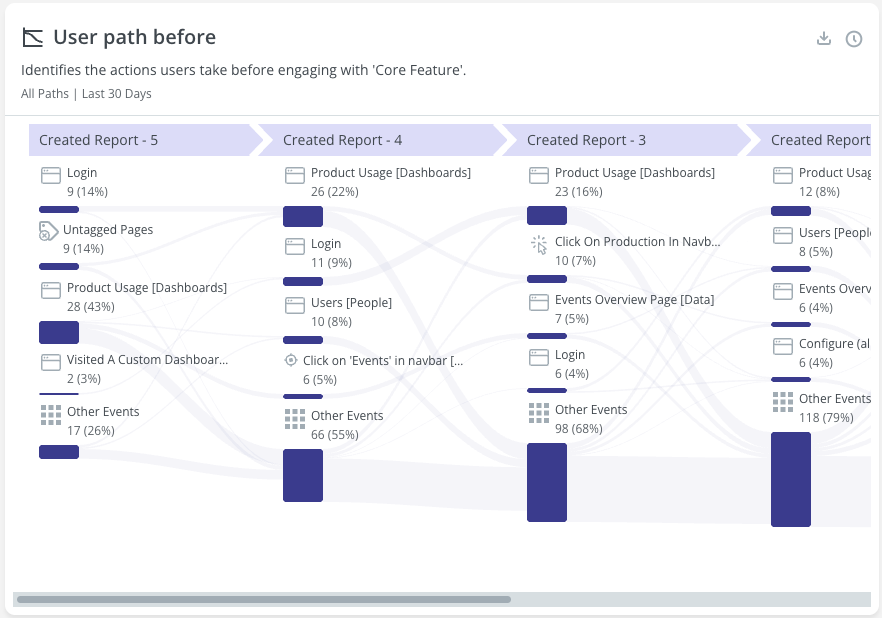
User path after
Shows the most common user paths (event occurrences and pages viewed) directly after performing the ‘Core Feature’ event.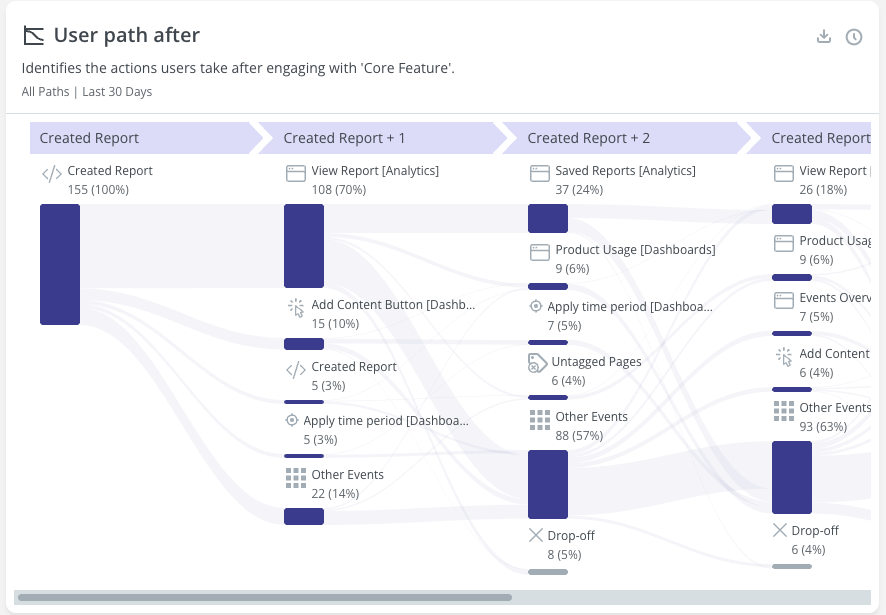
FAQs
How can I track feature engagement in Userpilot?
How can I track feature engagement in Userpilot?
You can track feature engagement in Userpilot through Labeled/ Tracked/ Custom events. This allows you to monitor how often users interact with those elements and gain insights into feature adoption. You can then create a Feature Engagament dashboard by selecting the respective event you wish to track as shown below:\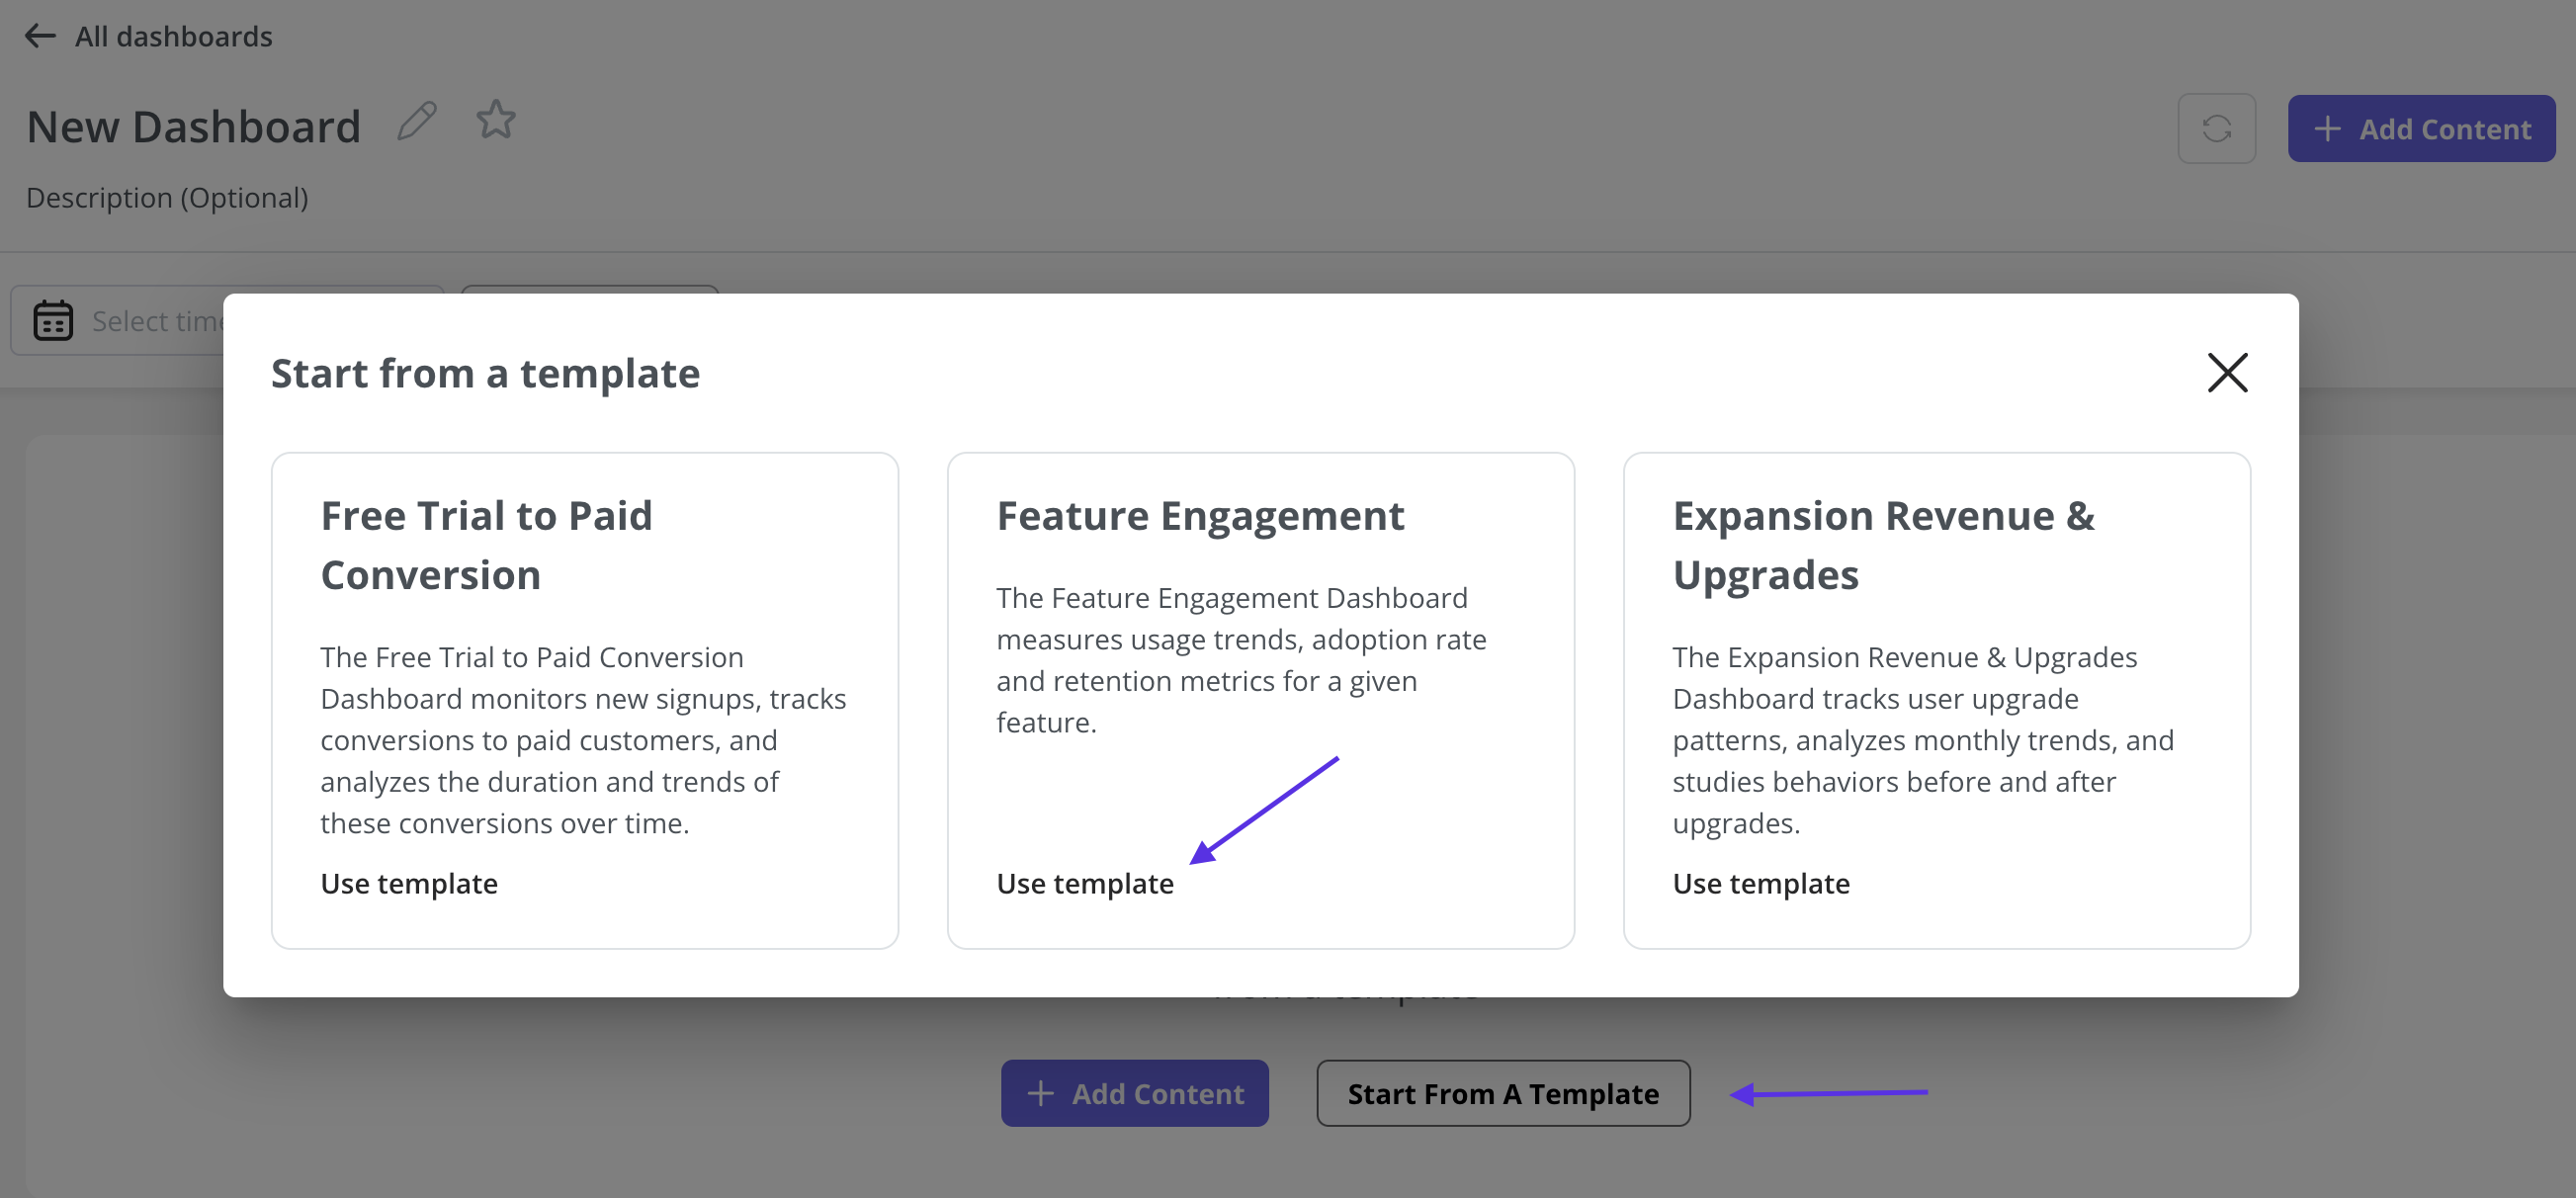
Can I track feature engagement without any code in Userpilot?
Can I track feature engagement without any code in Userpilot?
Yes, Userpilot allows you to track feature engagement without writing any code. Using the Visual Labeler functionality, you can visually select UI elements directly from your app and Label them as events. This enables you to track clicks and interactions with those elements without involving your development team and you can then create a feature engagement dashboard using the labeled events to get better insights into the analytics.