Overview
Userpilot’s Email Analytics gives you a detailed, real-time view of how recipients interact with your email. With built-in filters, visual trend graphs, and granular user-level reporting, you can monitor deliverability, engagement, and unsubscribe behavior, helping you refine your messaging and improve outcomes over time.Key Metrics and Completion Overview
At the top of the Analytics tab, you’ll find high-level performance indicators for the selected time period:- Sent: the total number of email messages sent.
- Total Delivered: the number of unique recipients who successfully received the email.
- Unique Delivered: the number of distinct recipients who successfully received the email. Each recipient is counted once, even if multiple emails were sent.
- Unique Opens: the number of distinct recipients who opened the email at least once.
- Unique Clicks: the number of distinct recipients who clicked at least one link or call-to-action (CTA) in the email.
- Bounces: the number of emails that could not be delivered due to invalid addresses or server issues.
- Spam: the number of recipients who marked the email as spam.
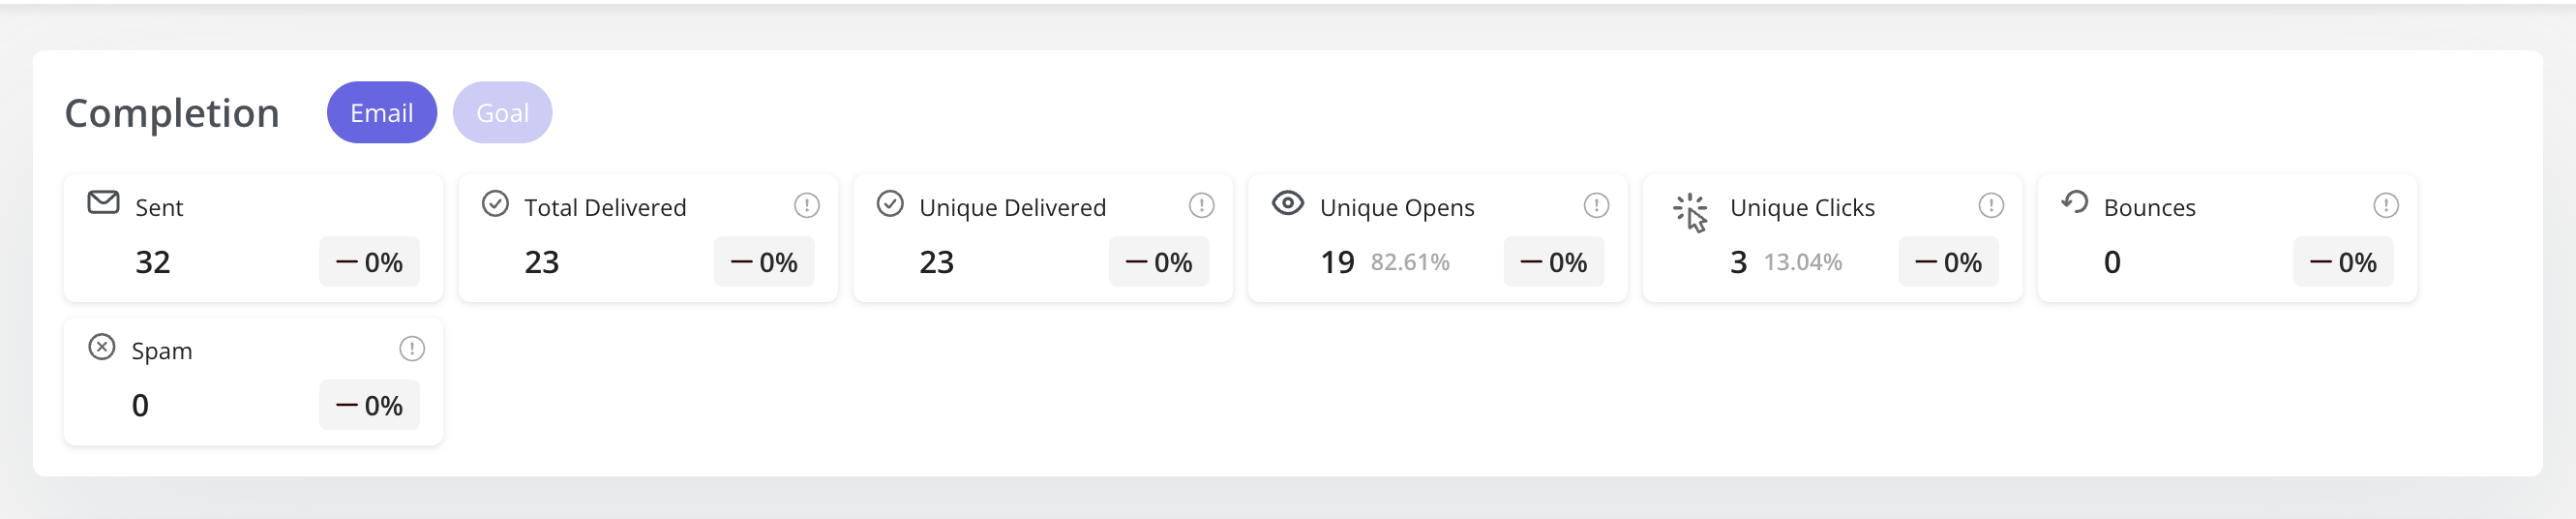
Each metric includes a visual indicator (green or red arrow) showing the percentage change compared to the previous period (e.g., +3% from the last 7 days).
Filters and Segmentation
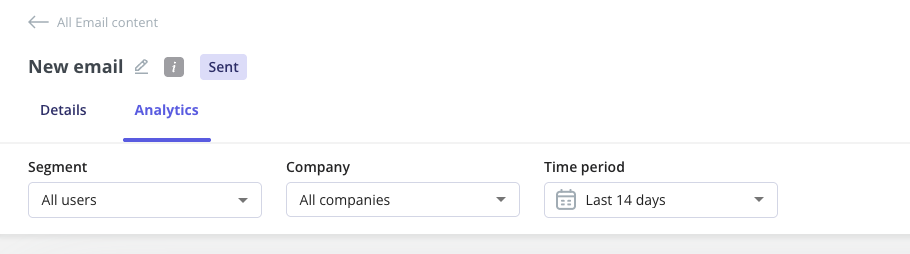
You can filter the data by:- Segment - based on defined user segments from the main dashboard.
- Company - filter by specific companies if applicable.
- Time Period - choose from preset ranges (e.g., Last 7 days) to view recent or historical trends.
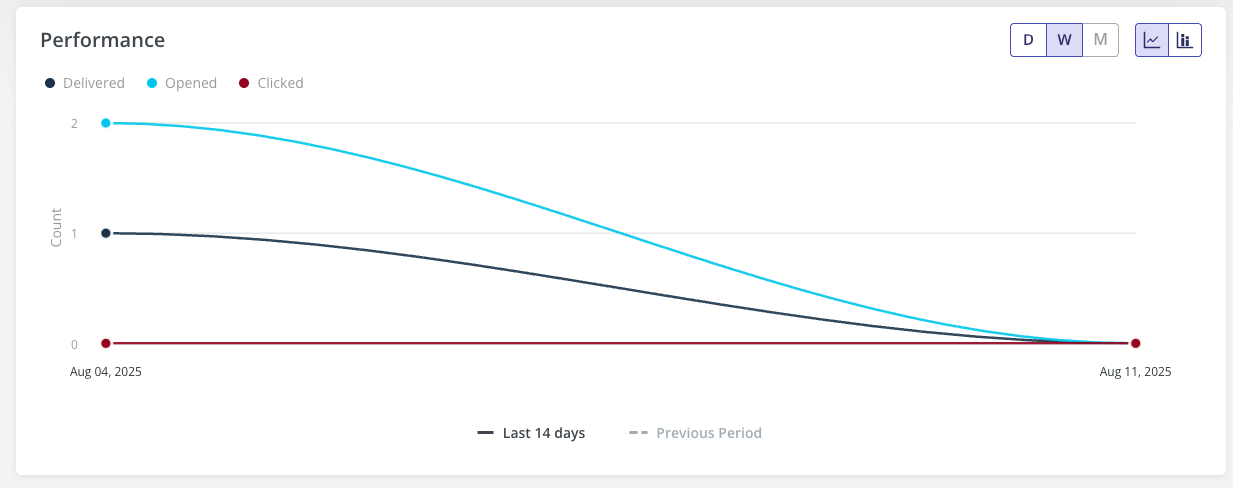
Performance Trends
The Performance graph helps you visualize user interactions over time. It displays daily counts for:- Delivered
- Opened
- Clicked
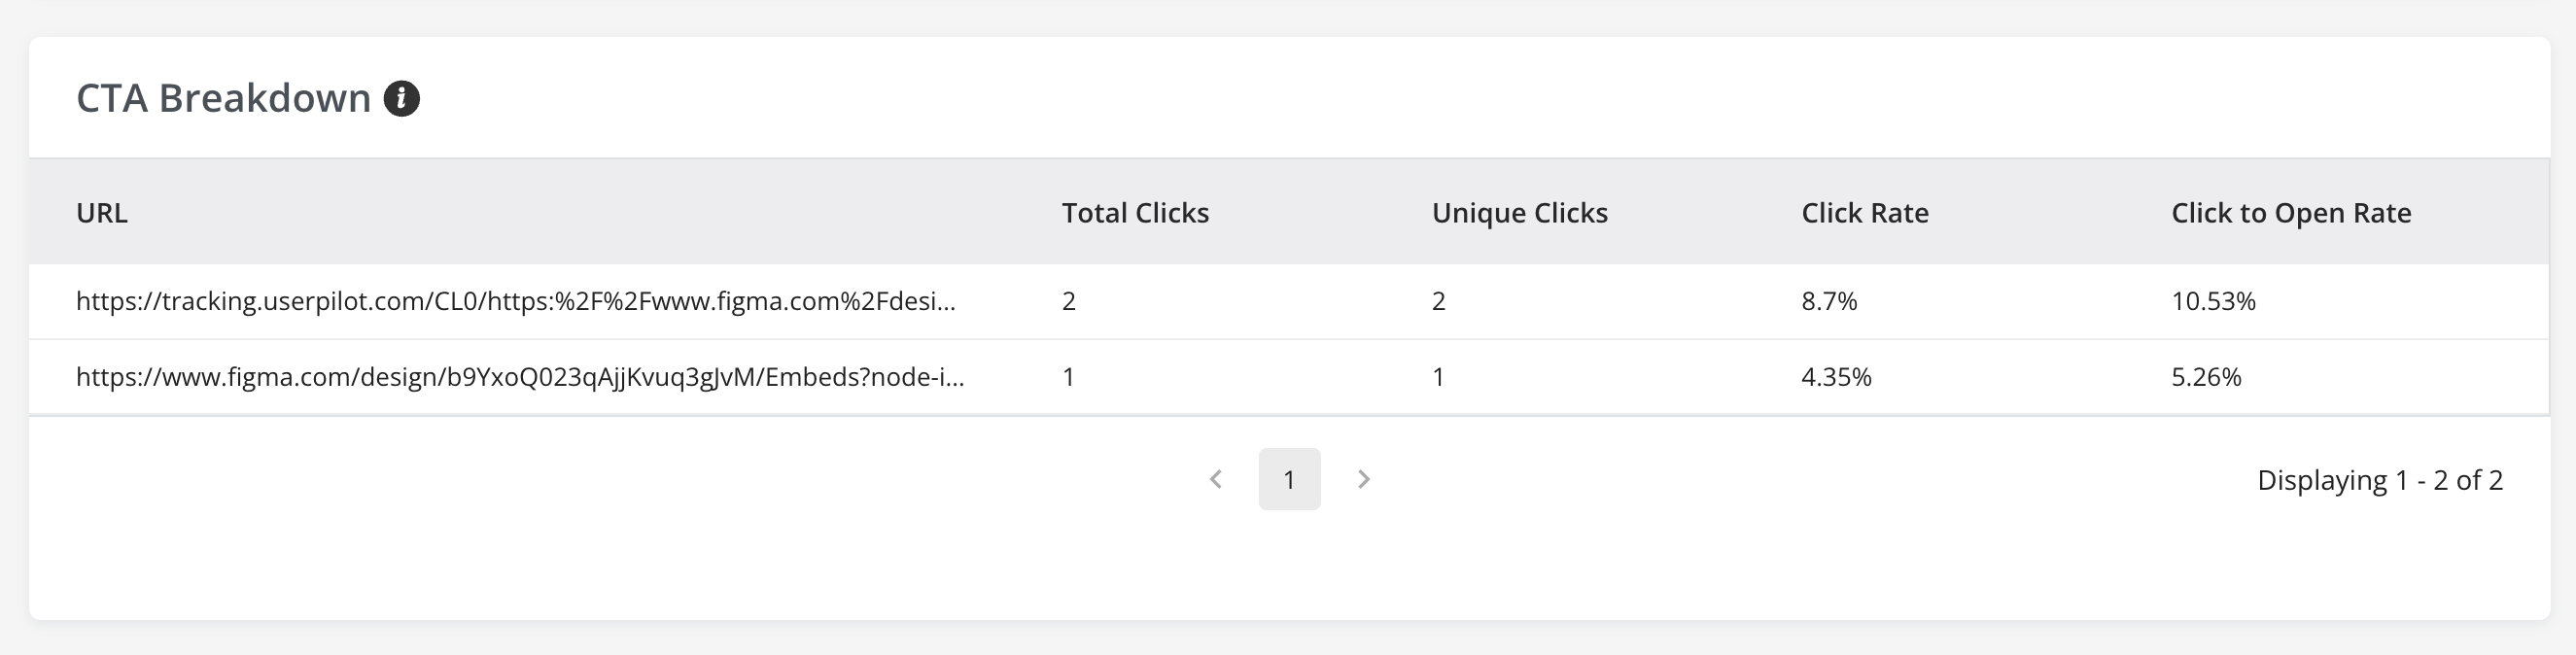
CTA Breakdown
The CTA Breakdown section shows how recipients interacted with each link in your email. It provides a detailed view of all clicked links, whether they appear in text, buttons, images, or videos, along with key engagement metrics for each one.Only links that receive at least one click are displayed.
Metrics explained
- Clicks
The total number of times the link was clicked. This includes multiple clicks from the same recipient. - Unique Clicks
The number of distinct recipients who clicked the link at least once. - Click Rate
The percentage of recipients who clicked the link, calculated as:
(Unique Clicks/Total Delivered Emails) × 100 - Click-to-Open Rate (CTOR)
The percentage of recipients who clicked the link after opening the email, calculated as:
(Unique Clicks/Unique Opens) × 100
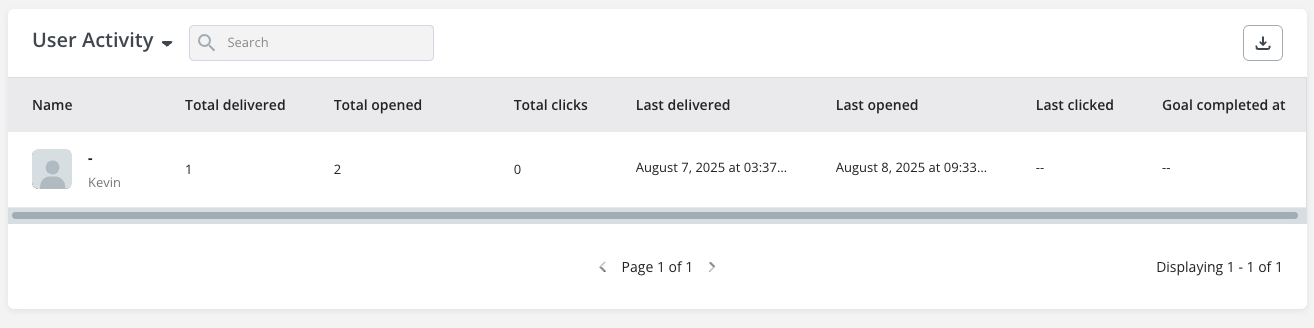
User-Level Activity Table
Below the graph, the User Activity section provides detailed breakdowns at the individual user level, including:- Name: The recipient’s name and ID identifier.
- Total delivered: Number of emails successfully delivered to the user.
- Total opened: Total times the user opened delivered emails.
- Total clicks: Number of times the user clicked links inside emails.
- Last delivered: Date and time the most recent email was delivered.
- Last opened: Date and time the user last opened an email.
- Last clicked: Date and time the user last clicked a link.
- Goal completed at: Timestamp of when the user completed the defined goal (if any).
Goal Tracking (if enabled)
If your email includes a goal (e.g., “Perform an Action”), Userpilot also displays:- Goal Completion - the number of recipients who achieved the defined goal.
Open Rate Accuracy and Apple Mail Privacy Protection
With Apple’s Mail Privacy Protection, some emails may be marked as “opened” even if the recipient hasn’t actually read them. This can cause open rates to appear inflated.To reduce this effect, Userpilot measures opens and clicks as one unique action per user per day, instead of counting every interaction.
Example:If a user opens the same email multiple times in one day, it is counted as one open for that day. If your time filter is set to Last 30 Days, and the same user opens the email multiple times per day across several days, each day’s first open is counted, but not the repeated ones.For more accurate engagement insights, we recommend focusing on clicks or engaged events rather than open rates.